2016issue C0633-41
Cash-secured put income, assignment, and reward-to-risk
This archive case study records a cash-secured put sold on SUNE, the mark-to-market and assignment path of a short put, and a reward-to-risk ratio that still left room for a loss if bankruptcy arrived immediately after entry. Editorial: read the workflow as a bounded income experiment that accepts a strike only after that filter is checkable.
- A cash-secured short put can still produce a mark-to-market loss if the underlying falls and the put's premium expands above the original sale price.
- If a short put finishes in-the-money and is not closed before expiration, the seller can be assigned long stock at the strike.
- In the illustrated SUNE example, a total wipeout by May left a maximum cash loss of 18 and a downside breakeven of 18 cents, for a reward-to-risk ratio of 177 percent, yet bankruptcy immediately after entry would most likely lose money.
- Discretionary technical rules that looked skillful in a rising tape lost their edge once the market turned sideways, so trade selection depends on market-regime, not pattern labels.
Collateral, premium, and assignment
A cash-secured put is a short put fully collateralized by cash equal to the strike obligation, so assignment becomes a planned stock purchase rather than leveraged exposure. An option-income-strategy is a rule-based procedure that sells premium for a defined holding period and treats entry, hold, and close as one testable process rather than a discretionary overlay.
A cash-secured short put can still produce a mark-to-market loss if the underlying falls and the put's premium expands above the original sale price. If a short put finishes in-the-money and is not closed before expiration, the seller can be assigned long stock at the strike. In-the-money means a put whose strike sits above the current underlying price, so expiration without an offsetting close can convert into long stock at that strike.
The illustrated SUNE sale
The case study sold one May 0.50 put on SUNE to open at 0.32 as an exception to a general dislike of this income setup. In the illustrated SUNE example, a total wipeout by May left a maximum cash loss of 18 and a downside breakeven of 18 cents, for a reward-to-risk ratio of 177 percent.
A risk-reward-ratio is a pre-entry bound that compares maximum collected premium to remaining downside if the name fails, used as a filter before the trade is accepted. A related October 0.50 short-put risk graph at the same 0.32 sale price is presented as risky, with any profit framed as statistically generous rather than assured.
Short SUNE May 0.50 put: profit versus share price
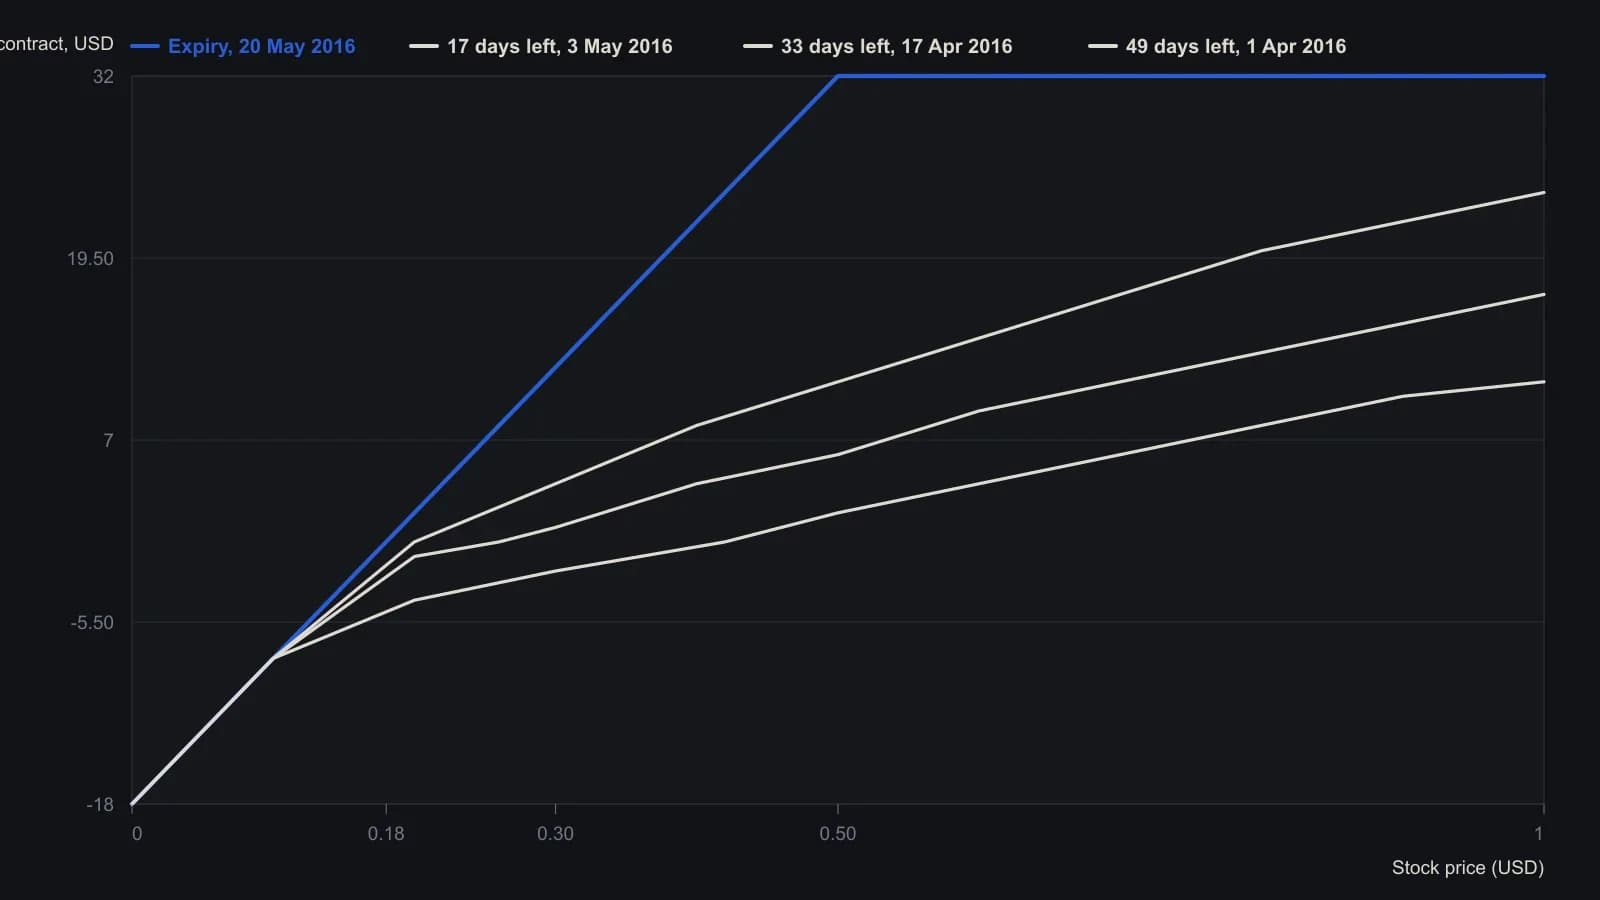
Pre-expiry profits are digitized from the raster to the nearest dollar; share-price markers are readable to about 0.02. The magazine caption names October 0.50 puts, but the plotted dates expire on 20 May 2016 and match the May 0.50 sale in the case study. A horizontal marker on the source plot sits near 0.42 and is the then-current share price.
Regime, gaps, and discarded indicators
Discretionary technical rules that looked skillful in a rising tape lost their edge once the market turned sideways, showing that trade selection depends on regime, not pattern labels. Market-regime is the prevailing directional and volatility condition that can make a pattern look skillful when it is only aligned with the current tape.
Back-tests of popular chart techniques found no overall statistical advantage until setups were conditioned on market conditions, after which most indicators were discarded.
On the Dow Jones Industrial Average, roughly 70 percent of opening gaps filled the same day as price worked back toward the prior close, an index-level mean-reversion bias used to justify concentrating on broad indexes rather than single momentum names. An opening-gap is the overnight jump from the prior close to the next open; in broad indexes the open often works back toward that prior close within the same session.
Editorial reading
Editorial: treat a cash-secured put as a bounded income experiment. First map the name's remaining life and implied-volatility regime, then accept only strikes where collected premium and assignment price leave a checkable reward-to-risk ratio before any order is placed. That reading is a TradersWeek framing of the archive workflow. It is not an archive claim and not an instruction to place the trade.
All readings on this track · 15 readings
- 1989Cash-secured puts and spreads versus buy-write overlays
- 1990Covered-call overlays fail a flexibility test until restated as puts and spreads
- 2005Covered-call supply, cash-secured puts, and conversion fair value
- 2007Covered calls and cash-secured puts as one income regime
- 2007Cash-secured puts, assignment risk, and post-entry overlays
- 2012Accumulation risk: protective puts, cash-secured puts, and spreads
- 2016Cash-secured put income, assignment, and reward-to-risk
- 2016Cash-secured puts under extreme implied volatility
- 2016A gold ETF range regime as a short-call ceiling, put floor, and short strangle
- 2017Weekly cash-secured puts filtered by intraday stochastic bands
- 2018Far out-of-the-money cash-secured puts as income and entry
- 2018Weekly equal-weight downtrend as a shared gate for VIX premium and put collateral
- 2019Bounding naked premium after a volatility spike
- 2020Cash-secured puts in a 2020 implied-volatility spike
- 2020Cash-secured put as a crash-regime overlay