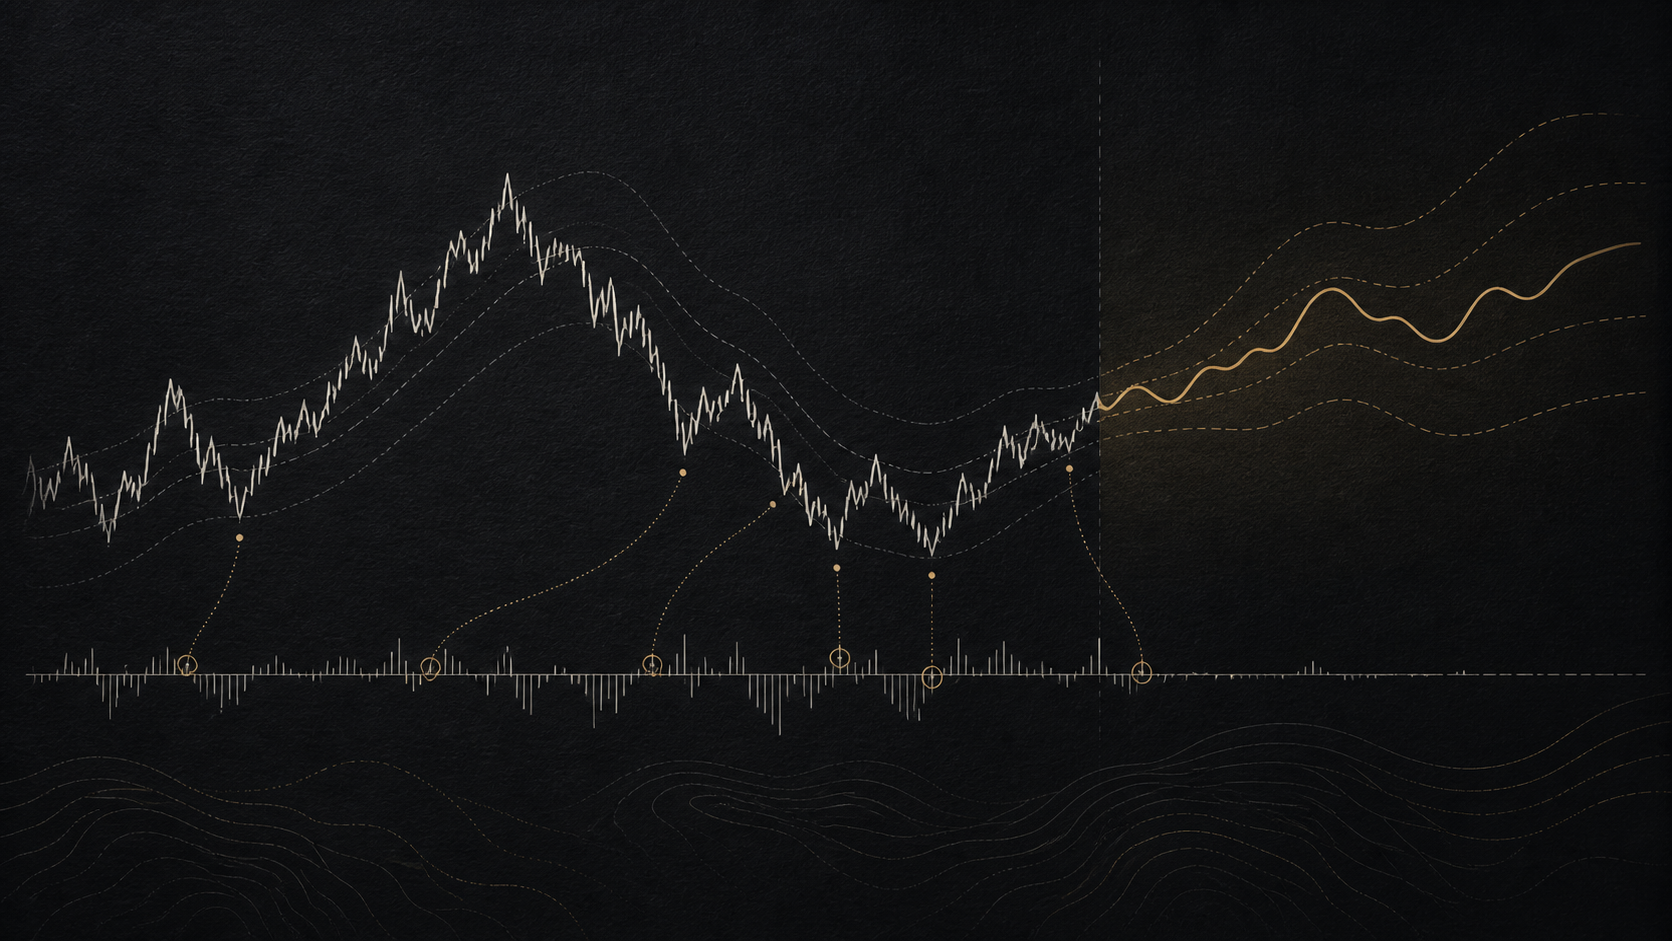
An Area Chart is a line chart with the space beneath it filled in. It emphasises the overall trend and the magnitude of moves.
How traders read it
- Visually highlights the trend and range.
- Uses closing prices, like a line chart.
- Common on dashboards and summary views.
See it in dtcharts
Switch chart type any time in the dtcharts terminal from the chart-type menu.