Order flow and footprint chartsOpen
the candle.
Order Flow splits every bar into the trades that made it: how much was bought at the ask and sold at the bid, at each price. On crypto, trade by trade from Binance. In Premium at $120 a month.
One candle.
115,107 trades.
TradersWeek Order Flow is a set of chart layers built from the trade tape instead of bars. A footprint opens each candle into price levels and shows, at every level, the volume bought at the ask and sold at the bid. Delta, cumulative delta, volume and market profiles and a heatmap come from the same tape, computed in your browser. Order Flow is part of Premium at $120 a month.
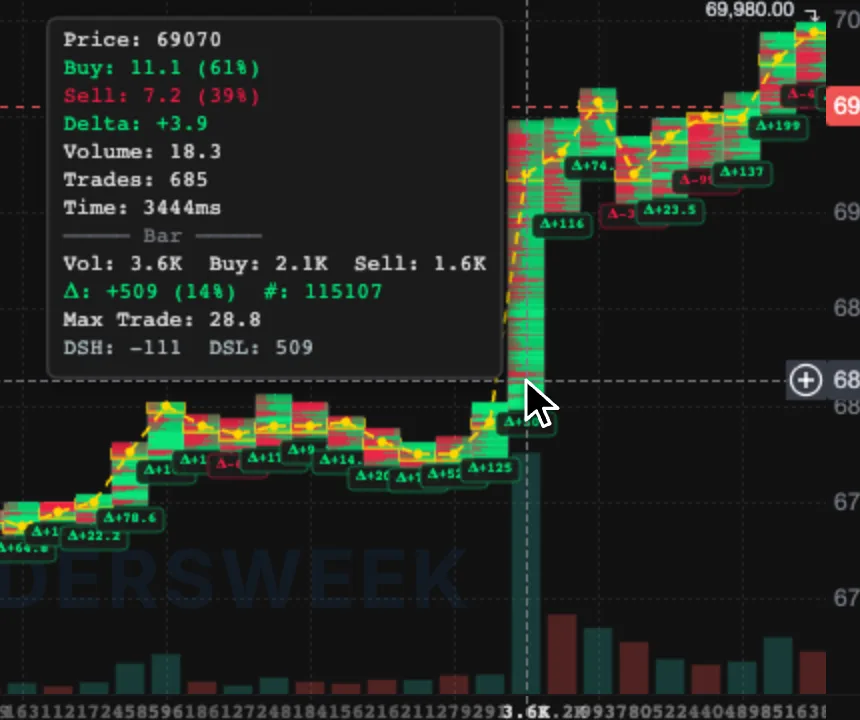
12 June 2024, 12:30 UTC, US CPI. 3.6K BTC traded in the bar: 2.1K bought at the ask, 1.6K sold at the bid, delta +509.
- Crypto
- Binance trades over WebSocket, older trades over REST as you scroll back
- In memory
- Up to 50,000 trades per symbol
- History
- 15 hours of trades below 1H, 30 on 1H and up, 48 on 1D, 168 on 1W
- Forex
- Trades rebuilt from the bid and ask stream, see the limits below
- Plan
- Premium, $120 a month
Five patterns
in the tape.
- 3×Imbalance
One side outtraded the other 3 to one: the ask at a price against the bid one level below. The ATAS convention.
- 3 levelsStacked imbalance
3 neighbouring prices in a row with the same imbalance. Drawn as a zone that stays until price comes back to it.
- 2.5×Absorption
A cell with 2.5 times the bar's average volume while neither side leads by more than 35%. Heavy trading that went nowhere.
- 1.5×Exhaustion
A bar with 1.5 times the average volume of the last 5, split at least 80 to 20 between buyers and sellers.
- 10 in 5 sIceberg
10 fills or more at one price within 5 seconds, 80% on one side: a resting order that keeps refilling.
These are the defaults. Every threshold is a setting in the Order Flow panel, and each detection goes to the Event Log with its price and time.
Switch on
what you read.
Footprint, profiles and the heatmap draw over the candles. CVD, bar delta and delta % open their own panes below. In a multi-chart layout every pane keeps its own set.
Next to the watchlist, the DOM tab shows the Binance order book, and an order from the ladder goes to the demo account.
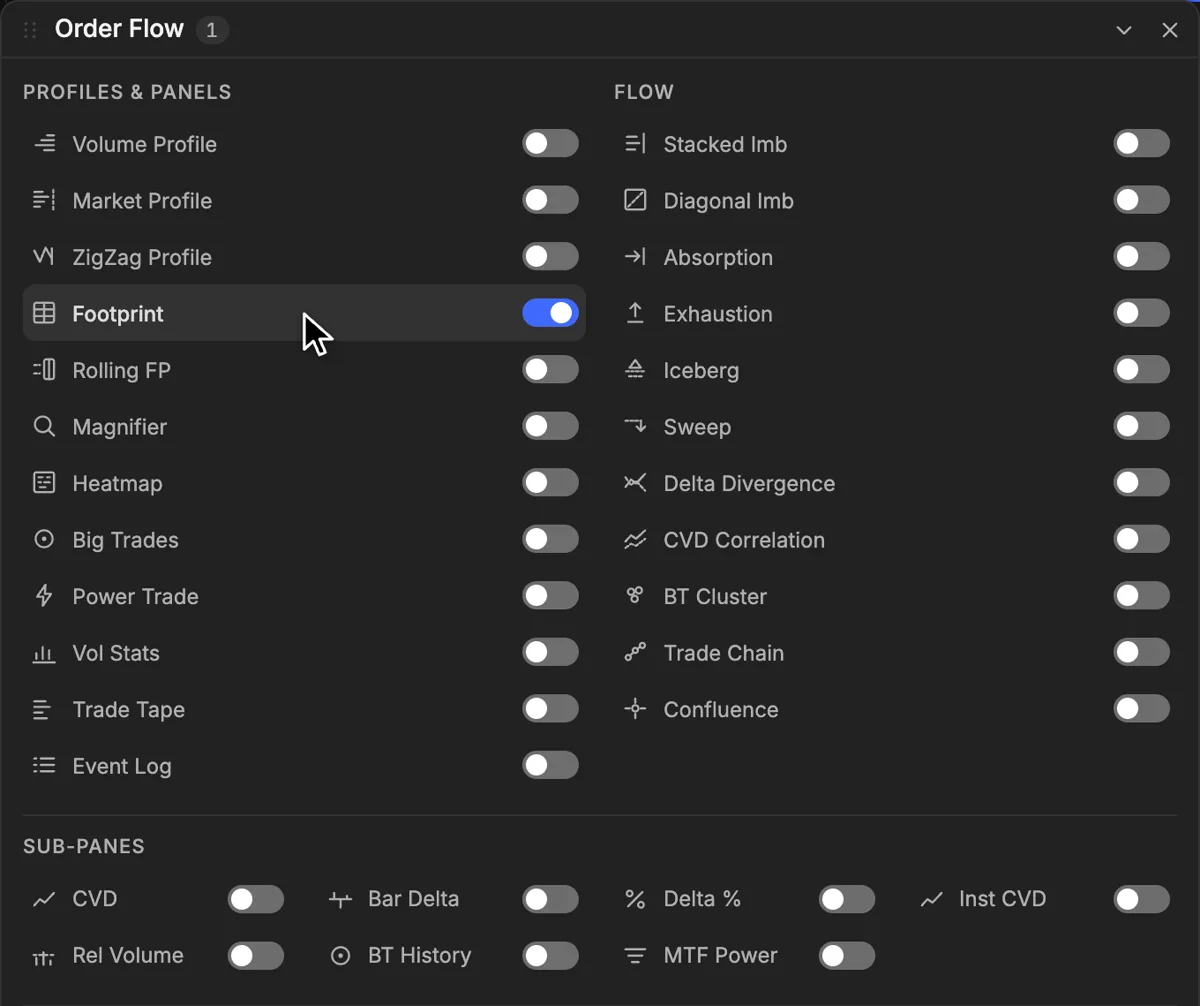
The Order Flow panel. Footprint on, everything else one switch away.
| Group | Layers |
|---|---|
| Profiles and panels | Volume Profile, Market Profile, ZigZag Profile, Footprint, Rolling FP, Magnifier, Heatmap, Big Trades, Power Trade, Vol Stats, Trade Tape, Event Log |
| Flow | Stacked and diagonal imbalance, Absorption, Exhaustion, Iceberg, Sweep, Delta Divergence, CVD Correlation, Big Trade Cluster, Trade Chain, Confluence |
| Panes below | CVD, Bar Delta, Delta %, Institutional CVD, Relative Volume, Big Trade History, Multi-TF Power |
| Cluster Search | Filters on footprint cells by volume, delta, bid, ask or trade count, at the high, the low or in the wicks |
| Strategy Builder | 6 rules for your own strategies: big trades, delta divergence and absorption, each way |
Where the tape
runs out.
Order flow is only as good as the trades behind it. Here is what we have, market by market.
- Crypto spot
Real trades from Binance, one by one, live and in history.
- Forex, metals, indices
There is no public tape. Trades are rebuilt from the bid and ask quotes of the MetaTrader bridge, and history from bars. Read delta there as an estimate.
- US stocks and ETFs
Off. These are Binance perpetual contracts, and their trades are not on the stream we read.
- Absorption
Marks heavy trading with balanced delta. It does not yet check that price stalled under the pressure.
Order flow questions
- Do I need paid data for footprint charts?
- No. Crypto trades come from Binance's public stream. Order Flow itself is part of Premium.
- Is the Volume delta chart type the same thing?
- No. That free chart type colours a bar by where it closed in its range. Order Flow counts every trade.
- Can I buy Order Flow on its own?
- Not at the moment. It comes with Premium at $120 a month, together with the other methods.
- Does it slow the chart down?
- The tape is kept in memory up to 50,000 trades per symbol, and only the visible bars are drawn.