2015issue C0628-31
Rebuilding a volume-weighted RSI and checking price-indicator divergence
A Volume-weighted RSI applies the Relative Strength Index transform to a ratio of averaged positive volume to averaged negative volume, so the oscillator stays between 0 and 100. Volume is signed against a six-period exponential average of closes. The archive workflow then reads Price-indicator divergence when price makes a new extreme that the oscillator and a slow Relative Strength Index do not confirm.
- A Volume-weighted RSI is the Relative Strength Index transform of averaged positive volume versus averaged negative volume, so the oscillator stays between 0 and 100.
- Volume is signed by whether the close is above or below a six-period exponential average of closing prices, then averaged first with 14-period simple averages and later with Wilder smoothing.
- The construction is meant to rise when up-day volume exceeds down-day volume relative to that exponential average, and to fall when the opposite imbalance appears.
- Price-indicator divergence is treated as a chart signal when price makes a higher high or lower low while the Volume-weighted RSI and a companion slow Relative Strength Index fail to confirm.
The oscillator
A Volume-weighted RSI can be built from the classic Relative Strength Index transform of a ratio of averaged positive volume to averaged negative volume. The oscillator stays between 0 and 100.
How volume is signed
Volume is signed by whether the close is above or below a six-period exponential average of closing prices. Volume is treated as zero when the close equals that average, and negative volume is stored as a positive quantity.
Averages, smoothing, and bounds
The first positive and negative volume averages are 14-period simple averages. Later values use Wilder smoothing that multiplies the prior average by 13, adds the newest signed volume, and divides by 14.
If average negative volume is zero, the oscillator is defined as 100. If average positive volume is zero, it is defined as 0. Those rules cover the divide-by-zero case.
Starting parameters
Default lookbacks of 6 and 14, plus 80/20 outer bands, are presented as starting parameters that can be changed to match the series.
What the construction is meant to show
The construction is meant to rise when up-day volume exceeds down-day volume relative to the exponential average. It is meant to fall when the opposite volume imbalance appears.
DJIA Slow Volume Strength Index from the source spreadsheet
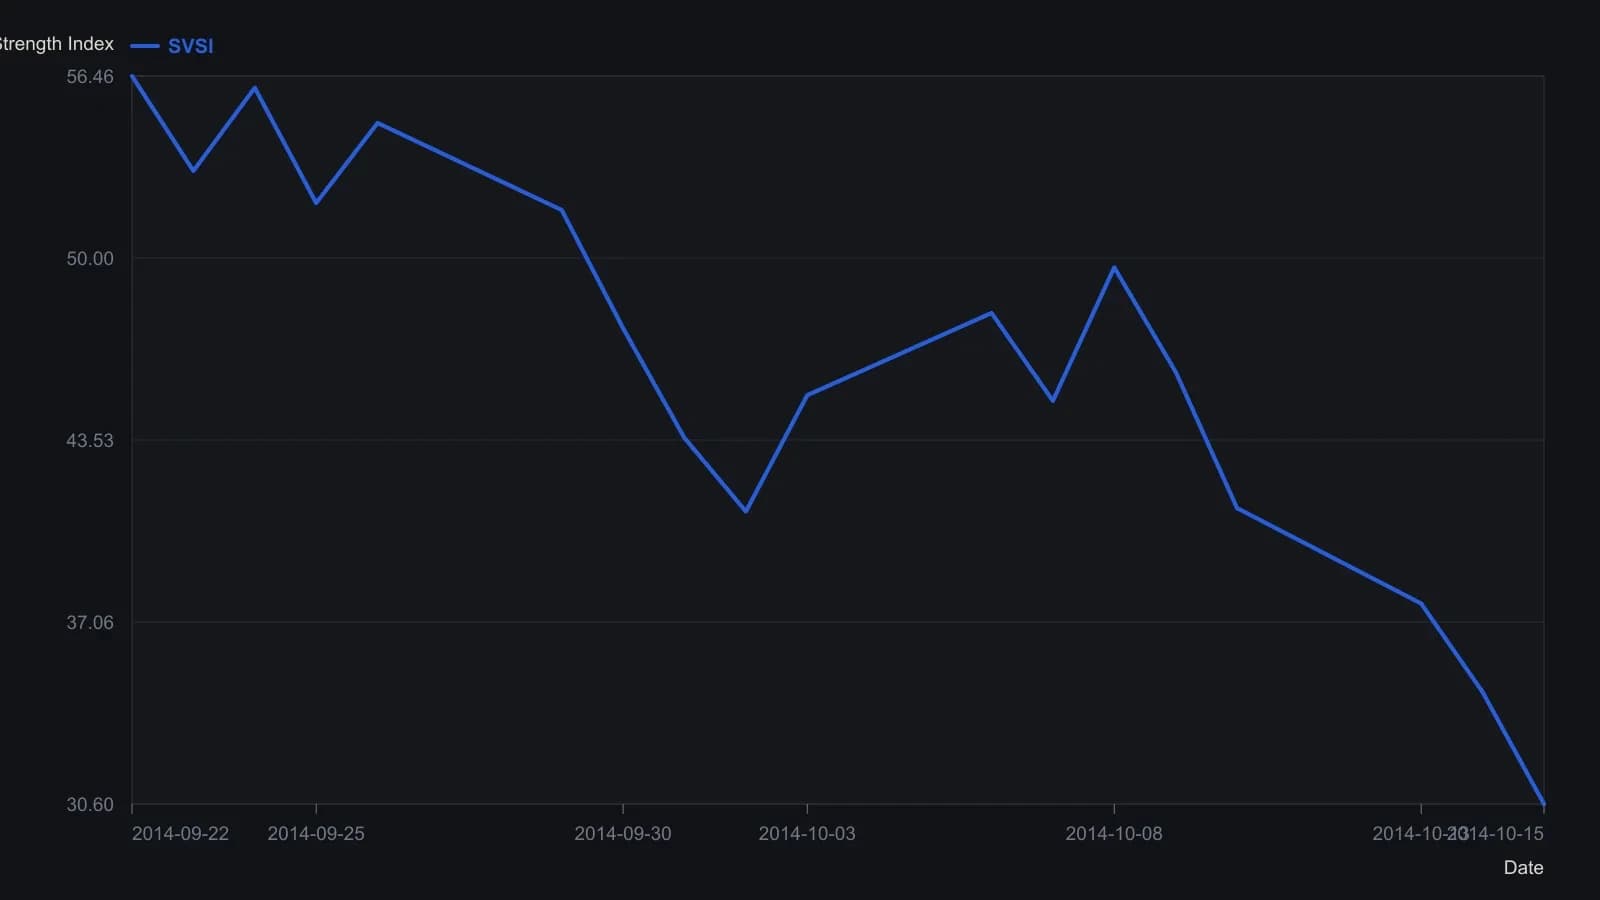
Volume is signed against a six-period EMA of the close; Wilder smoothing of the 14-period positive and negative volume averages prints SVSI only after the first full 14 observations, so the series begins on 22 September 2014.
Price-indicator divergence
Price-indicator divergence is treated as a chart signal when price makes a higher high or lower low while the Volume-weighted RSI and a companion slow Relative Strength Index fail to confirm. The reading is often checked against centerline crosses and price breakouts.
The historical workflow presents Price-indicator divergence as more usable in ranges or moderate channels than in strong trends. It suggests plotting the Volume-weighted RSI with a slow Relative Strength Index so turns can be cross-checked.
All readings on this track · 8 readings
- 1985Session windows, volume weights, and divergence in RSI construction
- 1989Constructing the money-flow index as a volume-weighted relative-strength oscillator
- 1992Constructing a money flow index from volume-weighted RSI
- 1994Constructing the money flow index as a volume-weighted relative strength index
- 2002Combine adaptive bands with the Relative Strength Index and volume-weighted RSI
- 2015Rebuilding a volume-weighted RSI and checking price-indicator divergence
- 2015Constructing the slow volume strength index from signed volume
- 2020Constructing a probability-defined trend filter