2015issue C0849-54
Constructing the slow volume strength index from signed volume
The slow volume strength index classifies each bar's volume by comparing the close with a short exponential moving average, averages the two volume series with Wilder-style smoothing, and maps their ratio through the standard relative strength index transform onto a 0-100 scale. The shared construction, not any single platform listing, is the object to reconstruct.
- Each bar's volume is classified as positive, negative, or unused by comparing the close with a short exponential moving average of the close.
- After the first bar, both volume averages use Wilder-style smoothing: multiply the prior average by 13, add the new classified volume, and divide by 14.
- The oscillator is the standard relative strength index transform of the positive-to-negative volume ratio, shown on a 0-100 scale with supplied references at 80, 20, and 50.
- Sample rules restated across TradeStation, eSignal, and Updata are chart hypotheses for reconstruction. The shared formula, not a vendor listing, is the teaching object.
A volume analogue of the relative strength index
The slow volume strength index is a 0-100 oscillator that assigns volume to the up or down side according to whether the close is above or below a short exponential moving average, then applies Wilder-style averaging and the relative strength index transform.
The construction is presented as a volume analogue of Wilder's relative strength index in which the usual close-to-close change is replaced by the close-versus-moving-average comparison that signs the volume. The result is a volume-weighted RSI: an RSI-style ratio that uses classified volume, rather than close-to-close price change, as the signed input.
SVSI versus Wilder RSI on daily Interactive Brokers
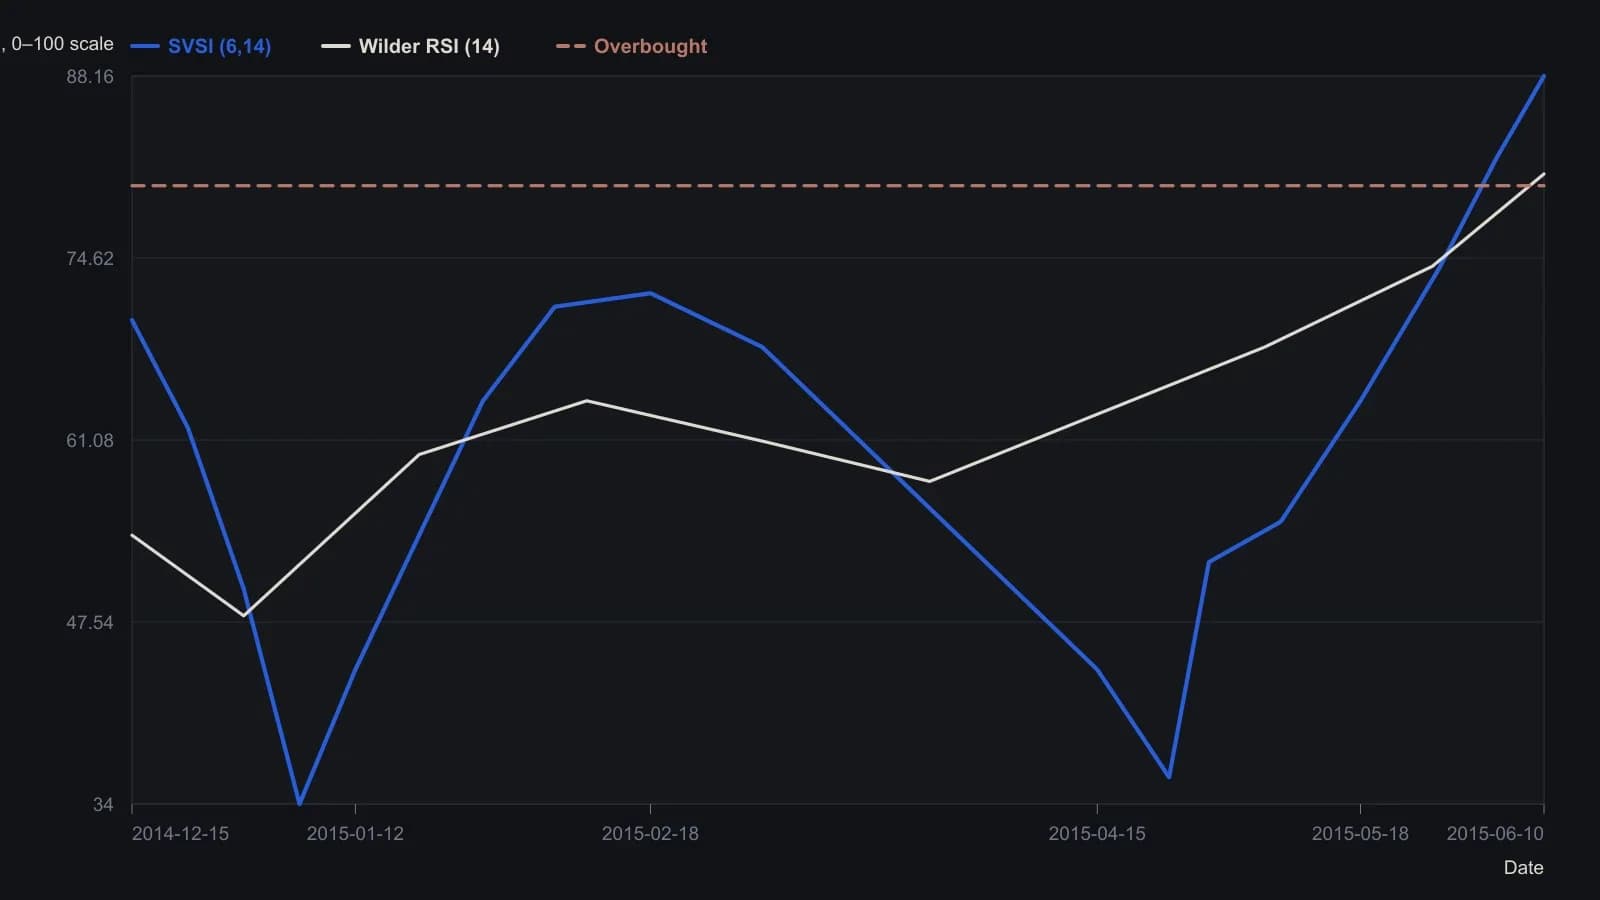
Construction defaults in the magazine code: 6-bar EMA signs each bar’s volume, 14-bar Wilder smoothing, guides at 80/20/50. Intermediate points follow the 16-point pane ticks and are approximate; only the 10 June 2015 closes (SVSI 88.16, RSI 80.88) are exact.
How each bar's volume is signed
The oscillator classifies each bar's volume as positive, negative, or unused by comparing the close with a short exponential moving average of the close, then averages those two volume series.
That exponential moving average is a recursively updated average of closing prices used here only to decide whether each bar's volume is treated as positive or negative.
When the close equals the exponential average, both the positive-volume and negative-volume inputs for that bar are set to zero.
Wilder-style smoothing and the bounded transform
After the first bar, both positive and negative volume averages are updated with Wilder-style recursion that multiplies the prior average by 13, adds the new classified volume, and divides by 14. That update matches the averaging convention of the relative strength index.
The intermediate ratio is defined as average positive volume divided by average negative volume when the negative average is not zero, and is otherwise set to 100. The oscillator is then 100 minus 100 divided by one plus that ratio, provided the ratio itself is not zero.
That last step is the relative strength index transform. It maps the positive-to-negative average ratio onto a bounded 0-100 scale.
Default lengths and reference levels
Default construction parameters shown in the implementations are an exponential-average length of 6, a smoothing length of 14, an upper reference of 80, a lower reference of 20, and a midpoint of 50.
Interpretation rules supplied with the implementations treat readings above 80 as overbought, readings below 20 as oversold, and also mention midpoint crosses and divergences as additional chart hypotheses. Those overbought and oversold bands, together with a centerline crossover through 50, are the supplied reference readings.
Sample rule sets and the shared formula
One sample rule set uses a close above a medium-term simple moving average as the trend filter, an oscillator print below 50 as the dip condition, and a next-bar market entry as the execution step.
A second sample rule set buys the next bar at market when the oscillator crosses above 50 and sells short the next bar at market when it crosses below 50.
The same volume-split, Wilder-smoothed construction is restated across multiple platform implementations, including TradeStation, eSignal, and Updata, so the teaching object is the shared formula rather than any one vendor listing.
All readings on this track · 8 readings
- 1985Session windows, volume weights, and divergence in RSI construction
- 1989Constructing the money-flow index as a volume-weighted relative-strength oscillator
- 1992Constructing a money flow index from volume-weighted RSI
- 1994Constructing the money flow index as a volume-weighted relative strength index
- 2002Combine adaptive bands with the Relative Strength Index and volume-weighted RSI
- 2015Rebuilding a volume-weighted RSI and checking price-indicator divergence
- 2015Constructing the slow volume strength index from signed volume
- 2020Constructing a probability-defined trend filter