2013issue C0853-58
Volatility band construction from Typical price and Mean deviation
The envelope is assembled as a Typical price midline plus an upper band and a lower band whose width comes from Mean deviation. Editorial reading: return those three series as reusable outputs so a stop-and-reverse breakout can be compared with an explicit filter, or substituted for other volatility envelopes such as Bollinger Bands.
- The envelope is a midline plus an upper band and a lower band, and those three series can be returned together as a multiple-output function.
- Typical price is the average of high, low, and close, and that series locates the center. Width comes from a one-bar typical-price change versus the prior low, averaged over a summing period and scaled by a deviation factor.
- Band average, summing period, deviation factor, and lower-band adjustment stay configurable. The lower band can be made narrower than the upper band.
- A sample stop-and-reverse rule goes long on a close through the upper band and short on a close through the lower band. The same outputs can be substituted into other envelopes, and a trend-or-range filter is suggested when a less directional market leaves too little room for price reactions.
A midline and two bands
The envelope is assembled as a midline plus an upper band and a lower band, and those three series can be returned together as a multiple-output function.
Editorial reading: treat that envelope as a three-part construction problem. Choose a Typical price center, measure a signed Mean deviation width, then expose the same midline and band pair as reusable outputs. A breakout rule can then be compared with an explicit filter rather than treated as a finished system.
Typical-price volatility envelope on Ford Motor
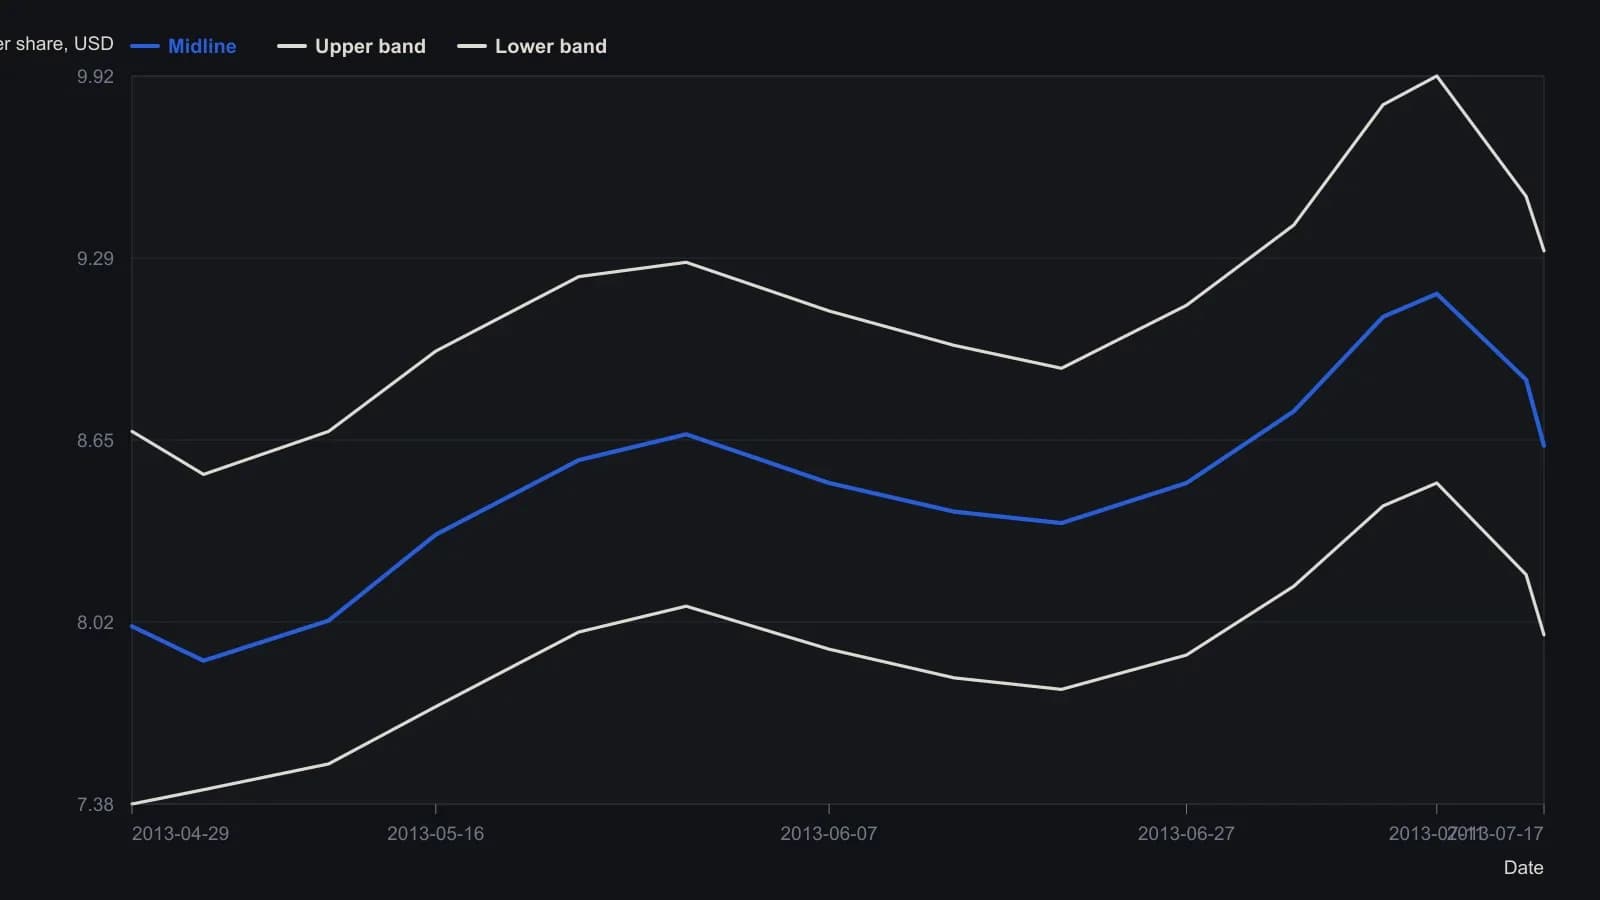
Study inputs on the source chart are band average 8, summing period 13, deviation factor 3.55 and lower-band adjust 0.9. Turning points are digitized to the nearest few cents; only the final prints are platform-labeled.
Typical price locates the center
Typical price is formed as the average of high, low, and close, and that series is the input used to locate the center of the bands.
Mean deviation sets the width
A one-bar typical-price change versus the prior low is averaged over a summing period, then scaled by a deviation factor to set band width.
The lower band can be made narrower than the upper band by multiplying the upper deviation by a separate lower-band adjustment.
Parameters stay open
Band average, summing period, deviation factor, and lower-band adjustment are exposed as configurable study parameters rather than fixed constants.
Reuse the outputs
A sample stop-and-reverse rule goes long on a close through the upper band and short on a close through the lower band.
The same band outputs can be compared with other volatility envelopes, such as ATR or Keltner ATR bands, by substituting the constructed series.
Editorial reading: substitution is why the three series are exposed together. The constructed pair can be lined up against Bollinger Bands or another envelope without turning the sample rule into the method.
A filter is an add-on
A trend-or-range filter is suggested as an add-on because a less directional market may leave too little room for price reactions.
Editorial reading: keep that filter outside the band construction so the envelope stays a reusable output set. The filter tests whether the market has enough direction for price reactions.