2001issue C011-6
A lookback range index for market variability
A mean-deviation-range score takes the logarithm of a lookback high-low span and divides it by the logarithm of lookback-length. The reading is a relative picture of market character. Averaging it over a defined sample produces a variability-rank of commodities and stock-sector indices.
- The mean-deviation-range is the logarithm of the lookback high-low span divided by the logarithm of lookback-length, so the score is expressed in relative rather than arithmetic units.
- With a five-bar window, the construction is the log of the five-bar high minus low, divided by the log of five. A higher reading is associated with more erratic movement and a lower reading with more contiguous movement.
- The measure is framed as a starting picture of market character, not as a generator of buy or sell signals.
- Average five-bar scores from October 1998 through October 2000 produced a variability-rank in which currencies showed the least erratic commodity behavior and Nasdaq 100 futures the most erratic futures behavior.
How the score is built
The index is built as the logarithm of the lookback high-low span divided by the logarithm of the lookback-length. That high-low span, converted with logarithms into a relative variability score, is the mean-deviation-range. Logarithms are used so the score is expressed in relative rather than arithmetic units.
Lookback-length is the number of consecutive bars whose highest high and lowest low enter the score. With a five-bar window, the construction is the log of the five-bar high minus low, divided by the log of five.
What the reading describes
A higher reading is associated with more erratic movement and a lower reading with more contiguous movement. The measure is framed as a starting picture of market character, not as a generator of buy or sell signals.
A historical variability-rank
Average scores from a five-bar lookback over October 1998 through October 2000 were used to rank commodities and stock-sector indices from least to most chaotic. That ordering is the variability-rank.
In that ranking, currencies showed the least erratic commodity behavior and Nasdaq 100 futures the most erratic futures behavior. Among the equity-sector indices ranked, gold and silver showed the least fluctuation and technology-heavy composites the most. The least-erratic equity-sector average still sat above the least-erratic commodity average in the same ranking.
Deutschemark five-day GAPO, 1998–1999
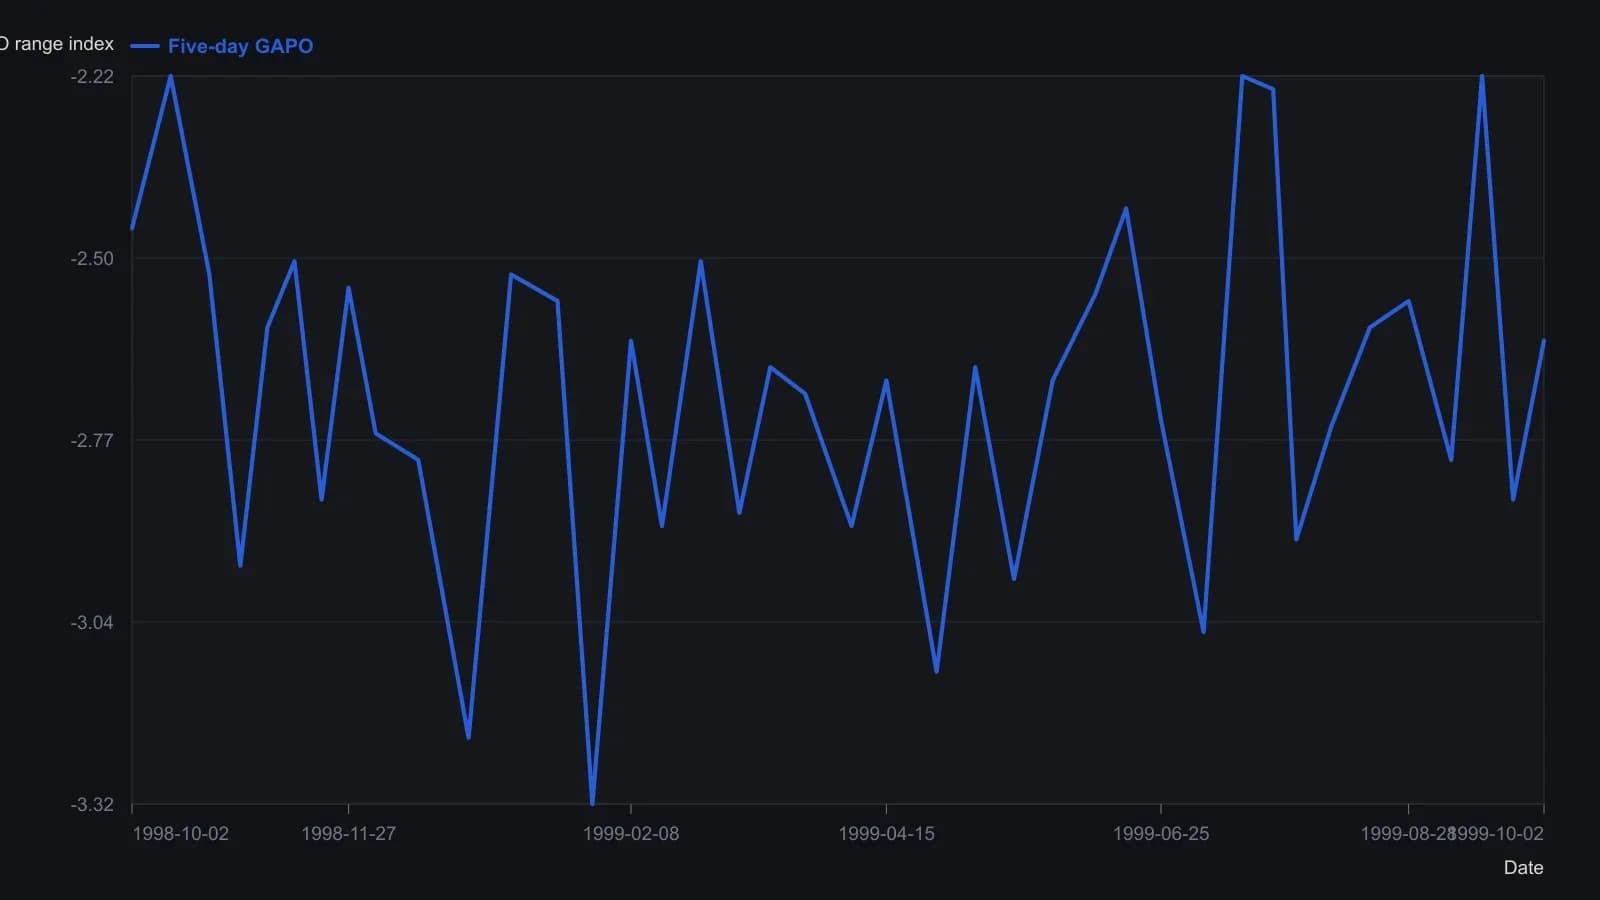
The source fixed the lookback at five sessions: log(highest high − lowest low) ÷ log(5). Values are digitised from the plotted indicator, so expect roughly a tenth of a point of reading error.