1989issue C081-3
Mean deviation versus squared dispersion for risk
When risk is framed as the spread of expected returns around their average, standard deviation and mean deviation summarize the same deviations under different weighting rules. A short ordered return sample, then one larger miss in place of the last observation, shows that squaring decides which points dominate the dispersion number.
- When risk is framed as the spread of expected returns around their average, a conventional summary of that spread is the standard deviation, which squares each deviation and therefore gives large misses more weight than small ones.
- Mean deviation averages the absolute values of the deviations and therefore weights every miss equally regardless of size.
- On the ordered returns 1, 2, 3, 4 and 5, mean deviation is 1.200 and the sample standard deviation is 1.4142; replacing the final 5 with 10 produces a 2-1/4 increase in the standard deviation while only doubling the average deviation.
- Skewness cubes the deviations, remains highly sensitive to large misses, and, unlike standard deviation or mean deviation, also indicates the direction of those misses.
Risk as a spread around the average
When risk is framed as the spread of expected returns around their average, a conventional summary of that spread is the standard deviation.
Each observation’s signed deviation from the mean is that observation minus the mean. Those signed deviations cancel and sum to zero.
Standard deviation squares deviations from the mean, so larger misses receive more influence than smaller ones.
Mean deviation averages the absolute values of the deviations from the mean of an ordered observation series. Every miss therefore receives equal weight over a defined lookback, regardless of size.
One ordered return sample
On the ordered returns 1, 2, 3, 4 and 5, mean deviation is 1.200 and the sample standard deviation is 1.4142.
A population standard-deviation estimate divides by n-1, whereas the sample calculation shown uses n.
Replacing the final 5 with 10 produces a 2-1/4 increase in the standard deviation while only doubling the average deviation.
Editorial: After that single larger miss is substituted, the gap between a doubled mean deviation and a 2-1/4 rise in standard deviation shows that squaring, not the series itself, decides which points dominate the dispersion number.
Ordered returns before and after one larger miss
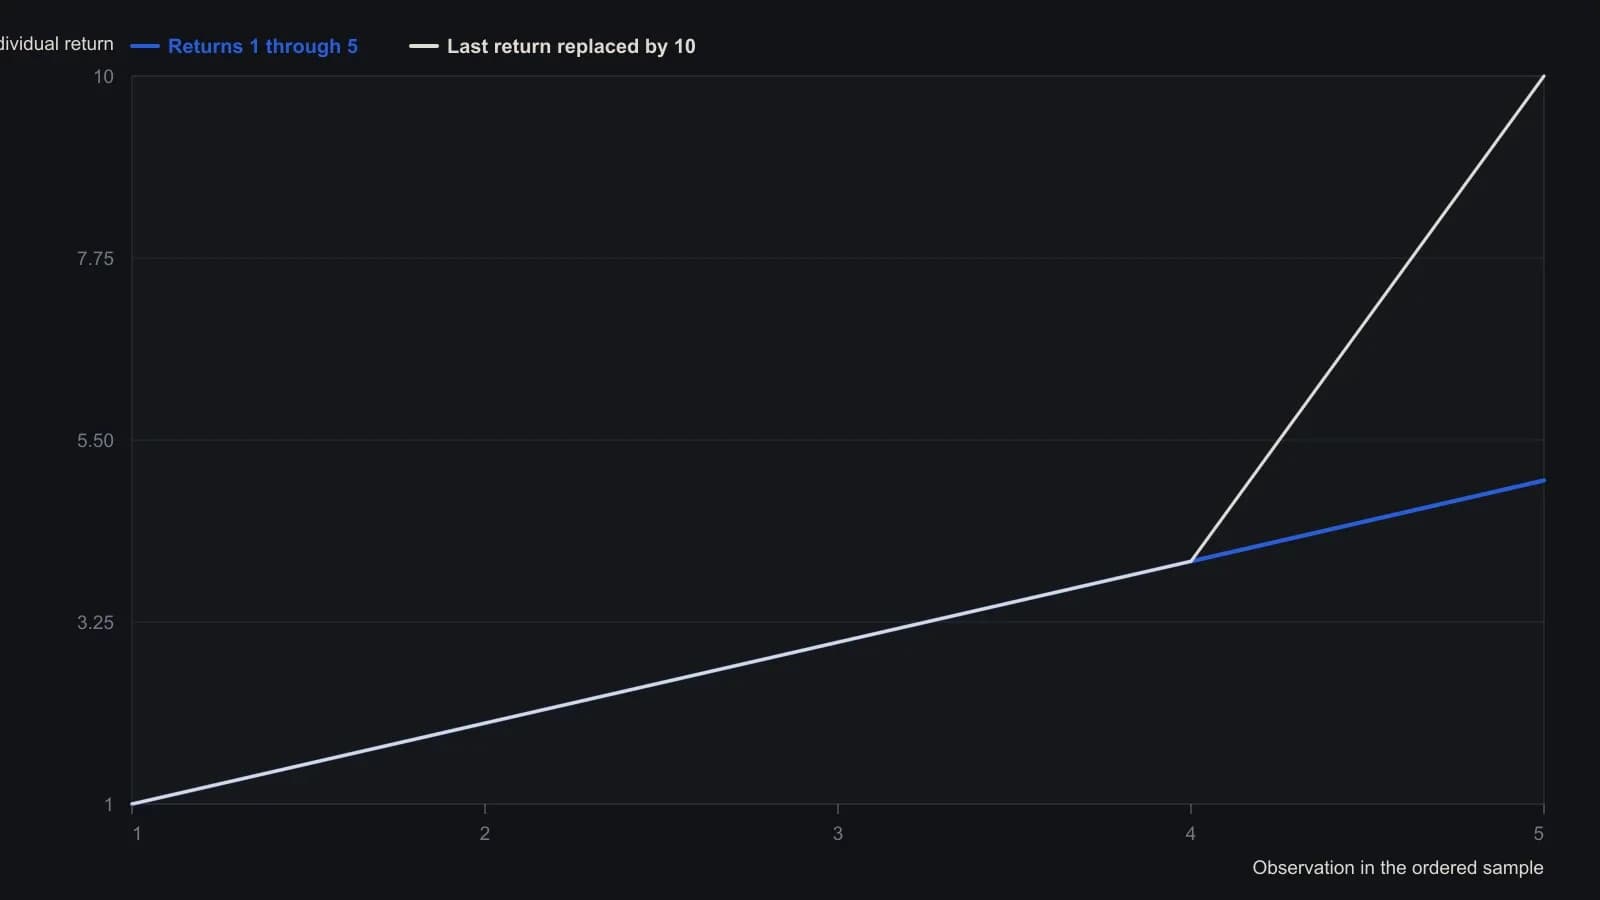
The article computes standard deviation with n in the denominator, not n − 1, and states the second-sample change as a doubling of mean deviation versus a two-and-a-quarter rise in standard deviation.
Skewness after the second moment
If standard deviation is kept as the second moment about the mean, the third moment, skewness, cubes the deviations and scales them by n times the cube of the standard deviation.
Positive skewness means more than half of the deviations lie on the negative side of the mean, while the large deviations lie on the positive side.
Skewness is highly sensitive to large misses and, unlike standard deviation or mean deviation, also indicates the direction of those misses.