2012issue C1156-58
Pixel-grid pullback and sector color alignment
A 2012 review described a two-axis grid-chart that paired each close with a signal-bar and a pixel-field of colored squares. This note records the named shapes, the three-reading pullback-pattern, and the sector-array used for color-alignment, including one computer-hardware session in which those reads shared a date.
- The grid-chart placed a colored signal-bar beside each close and treated the pixel-field as the surface where named shapes were read.
- A pullback-pattern required signal-bars to alternate color across three readings and required same-color pixels to connect at 45 degrees from the first reading to the third.
- A scan-window returned symbols with sector labels, and a sector-array showed whether a group's rectangles were mostly one color.
- Editorial reading: a case-study setup is treated as complete only when a named pixel shape, the pullback rule, and color-alignment agree on one session.
The daily grid-chart
The 2012 review described a two-axis daily grid-chart. A colored signal-bar sat beside each closing price. The pixel-field to the right was treated as the surface where shapes were read.
YPF SA (ADR) daily closes on the StockchartsPro grid
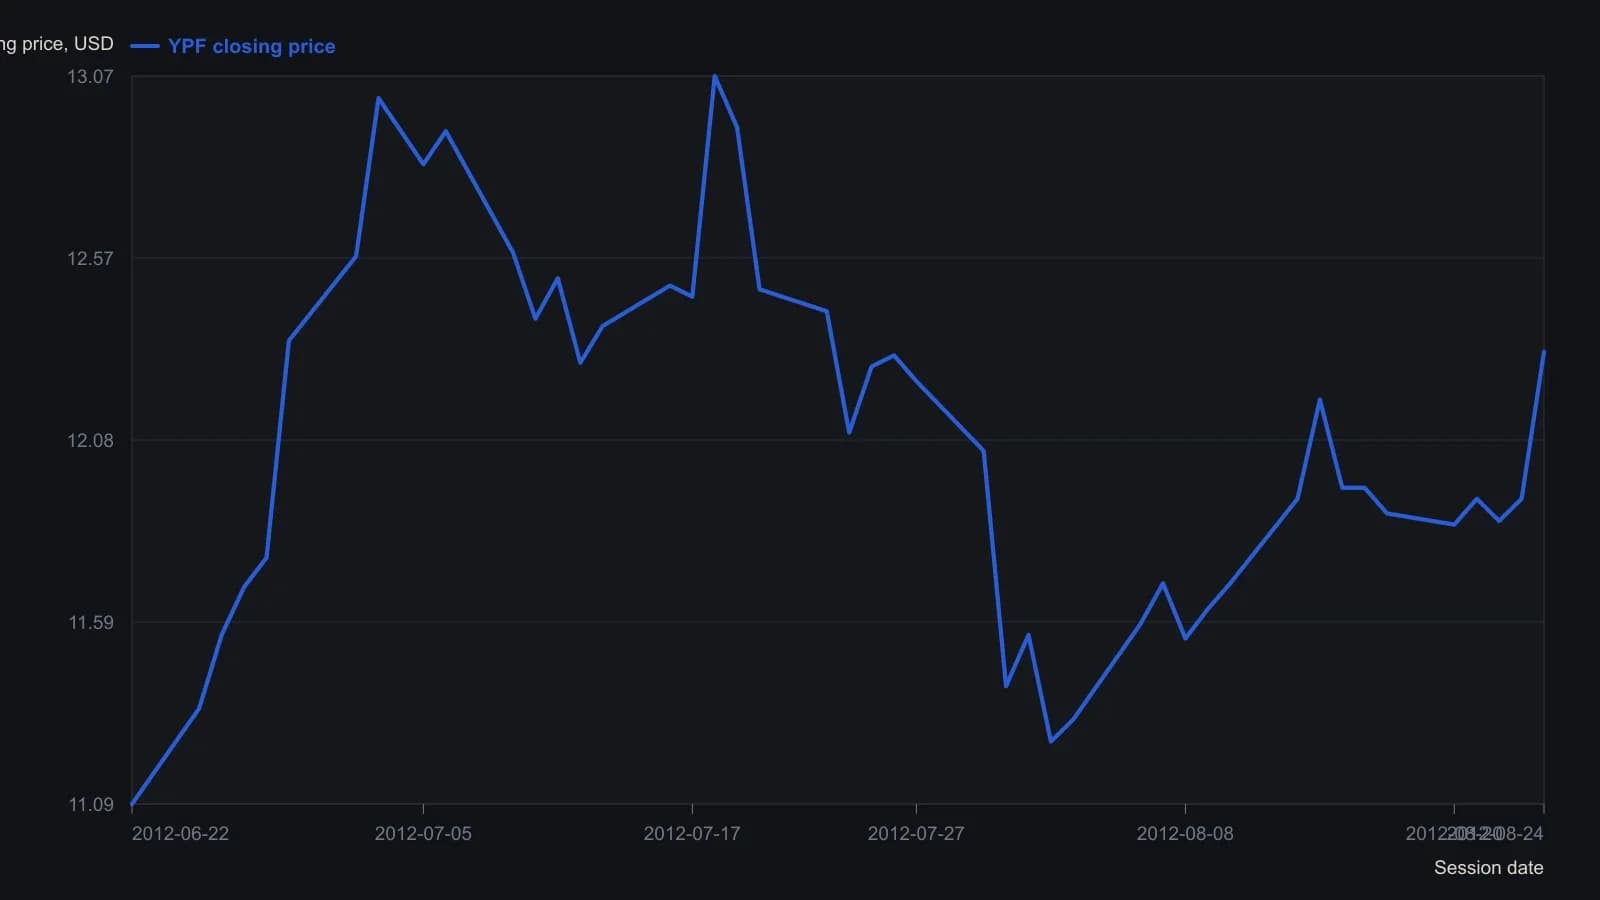
Each row is one trading session; weekends and the 4 July holiday are omitted, matching the printed grid. Signal-bar colors and the pixel field are not numeric series and are not plotted.
Named pixel formations
The review named three pixel formations: a right triangle, a pullback, and a mini pullback.
The triangle-pattern rule asked for one color to leave a corner and travel outward and downward at 45 degrees. Observed examples were described as often having a cut-off top and a few opposite-color squares in the interior.
The pullback-pattern
A pullback-pattern required signal-bars to alternate color across three readings. It also required same-color pixels to connect at 45 degrees from the first reading to the third.
Scan-window and sector-array
A scan-window was a user-set date range. It returned a symbol list that included each name's sector so a later group screen could supply industry context.
Opening a subsector produced a sector-array with one company per column and one date per row. That matrix allowed a visual read of whether the group's rectangles were mostly one color.
Color-alignment treated a green marker in a mostly green field, or a red marker in a mostly red field, as the intended match. A lone opposite-color marker was treated as a mismatch.
A same-date computer-hardware case
On 31 July 2012, one computer-hardware name carried a green marker inside a mostly green group field. That name's grid-chart also showed a pullback buy on the same date.
All readings on this track · 10 readings
- 1997A two-gate held-out test of hand-labeled pullback nets
- 2004A 50-day average touch as a screening procedure
- 2005Write a moving-average pullback as one procedure
- 2005How to write a short moving-average pullback as one procedure
- 2007Failed-breakout shorts with a half-width exit
- 2008Three-gate pullback entries from exchange tick breadth
- 2010Clear-method noise alerts for swing entries and exits
- 2011Same pullback rules, different market modes
- 2012Pixel-grid pullback and sector color alignment
- 2013Untested pullback entries need quantified exits