2004issue C031-9
Construct a mechanical rank for triangular formations
A triangular formation is a contracting oscillation toward an equilibrium point. This article shows how a linear-regression-line, residual series, and a simple daily rank turn that visual shape into a programmable test, and why a high rank can still disagree with the eye.
- A triangular formation is a contracting oscillation toward an equilibrium point, grouped with triangles, pennants, and wedges.
- A mechanical scan translates that geometric shape into numbers so analysts who follow many equities need not inspect every chart by eye.
- Closes are split into temp-up and temp-down residual series around a linear-regression-line so a computer can test whether the two sides converge.
- The triangular-pattern-rank is a daily-chart classifier by shape and volume behavior, and a high rank can disagree with a visual triangular look.
What a triangular formation is
A triangular formation is a contracting price structure in which oscillation moves toward an equilibrium point. The archive groups these structures with triangles, pennants, and wedges.
These formations are presented as typically appearing during strong trends, after price has moved quickly enough that nearby support or resistance may be thin beyond a break of the structure.
Why translate the shape into numbers
A mechanical recognition method is proposed so analysts who follow many equities can translate a geometric triangular shape into numbers instead of inspecting every chart by eye.
How a line substitutes for a shape
Linear regression answers the geometric question of which line can substitute for a shape. That substitute is the linear-regression-line: a single slope and intercept fitted to a cloud of price points. The sign of slope A is used as a rising or falling description of that shape.
The coefficient r-squared is treated as a linearity rank between 0 and 1. Values near 1 mean the points hug the linear-regression-line. Values near 0 mean they do not.
How the two sides are tested
The construction splits closes around the linear-regression-line into an upper residual series and a lower residual series. The upper series is temp-up, the positive residuals of closes above the line. The lower series is temp-down, the negative residuals of closes below the line. Each series is then regressed so a computer can test whether the two sides converge.
What the rank is and is not
The simplest triangular-pattern-rank is introduced as a daily-chart classifier of candidate formations by shape and volume behavior. It is presented as an incomplete filter rather than a complete trading system.
When the eye and the rank disagree
A visual triangular look and a high rank can disagree. Some charts look triangular without confirmation. Some high-rank structures do not look especially triangular.
Construction checks
Practical construction caveats include verifying that packaged slope and r-squared functions match the stated formulas. Dynamic zigzag-dependent windows should be computed only on data available as of the date under test.
ABI daily closes through the December 2001 triangle
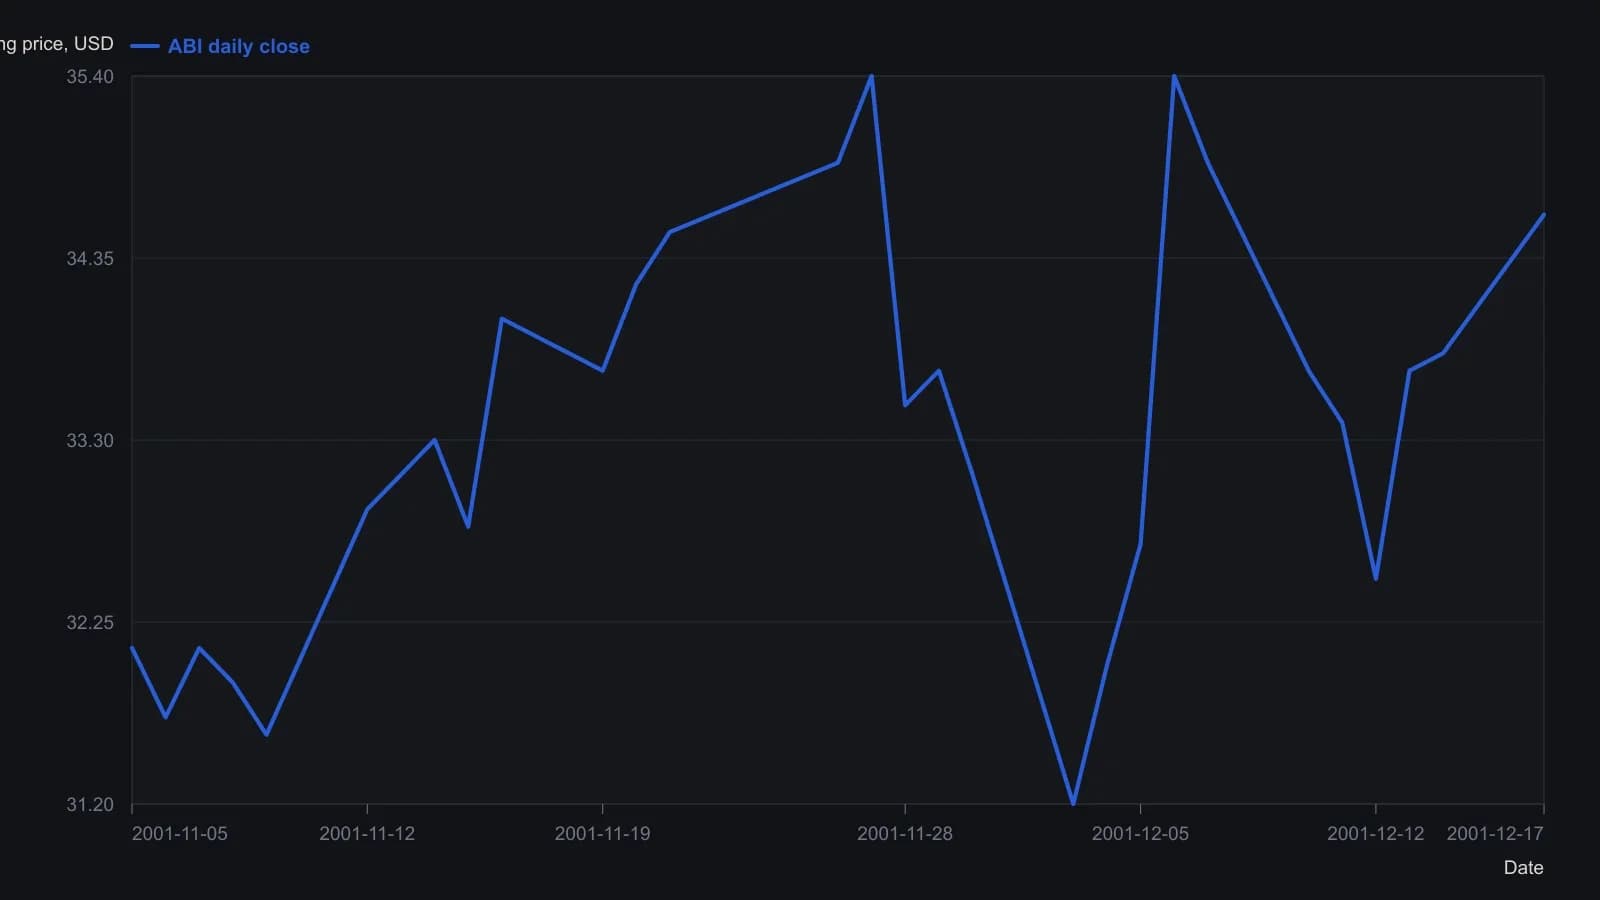
The source scored this ABI formation a triangular pattern rank of 6 and said volume during the contraction kept the rank from going higher. Dates follow the Monday axis ticks (12 November through 17 December 2001). Values are approximate readings from the raster, reported to the nearest 0.1.
All readings on this track · 5 readings
- 1990Constructing continuation patterns from congestion geometry
- 1996Construct the coil first, then time the apex and the measured move
- 1998The triangle is a waiting room until a two-touch line breaks
- 2004Construct a mechanical rank for triangular formations
- 2004Compact structure as a two-step candlestick and triangle test