2016issue C0549-54
MACD as a zero-line state map with average and Aroon filters
A May 2016 implementation recasts MACD as a color-coded zero-line state tool, then layers a 34-period weighted average, a 55-period exponential average, and a 25-period Aroon pair as further filters. The archive shows a portable coloring recipe, caution symbols, and two example readings.
- Treat the sign of MACD versus zero as a market-state flag, painted in two colors, rather than as a standalone entry trigger.
- Use a 34-period weighted average and a 55-period exponential average together as a slower context filter and as the rules for caution symbols.
- Read Aroon-up and Aroon-down crossovers on a 25-period lookback as a separate line-style hint of a possible trend change.
- The zero-line cross produces fewer alerts than MACD with its standard signal line, and a background tint by MACD sign leaves ordinary candle colors visible.
A color-coded zero-line state
A May 2016 implementation set recasts the classic MACD as a color-coded zero-line state tool, then layers slower moving averages and the Aroon indicator as additional filters.
Editorial terminology: MACD is a two-average oscillator whose sign relative to zero is used as a market-state flag rather than a standalone entry trigger.
MACD histogram versus the zero line, 14 March 2016 scan
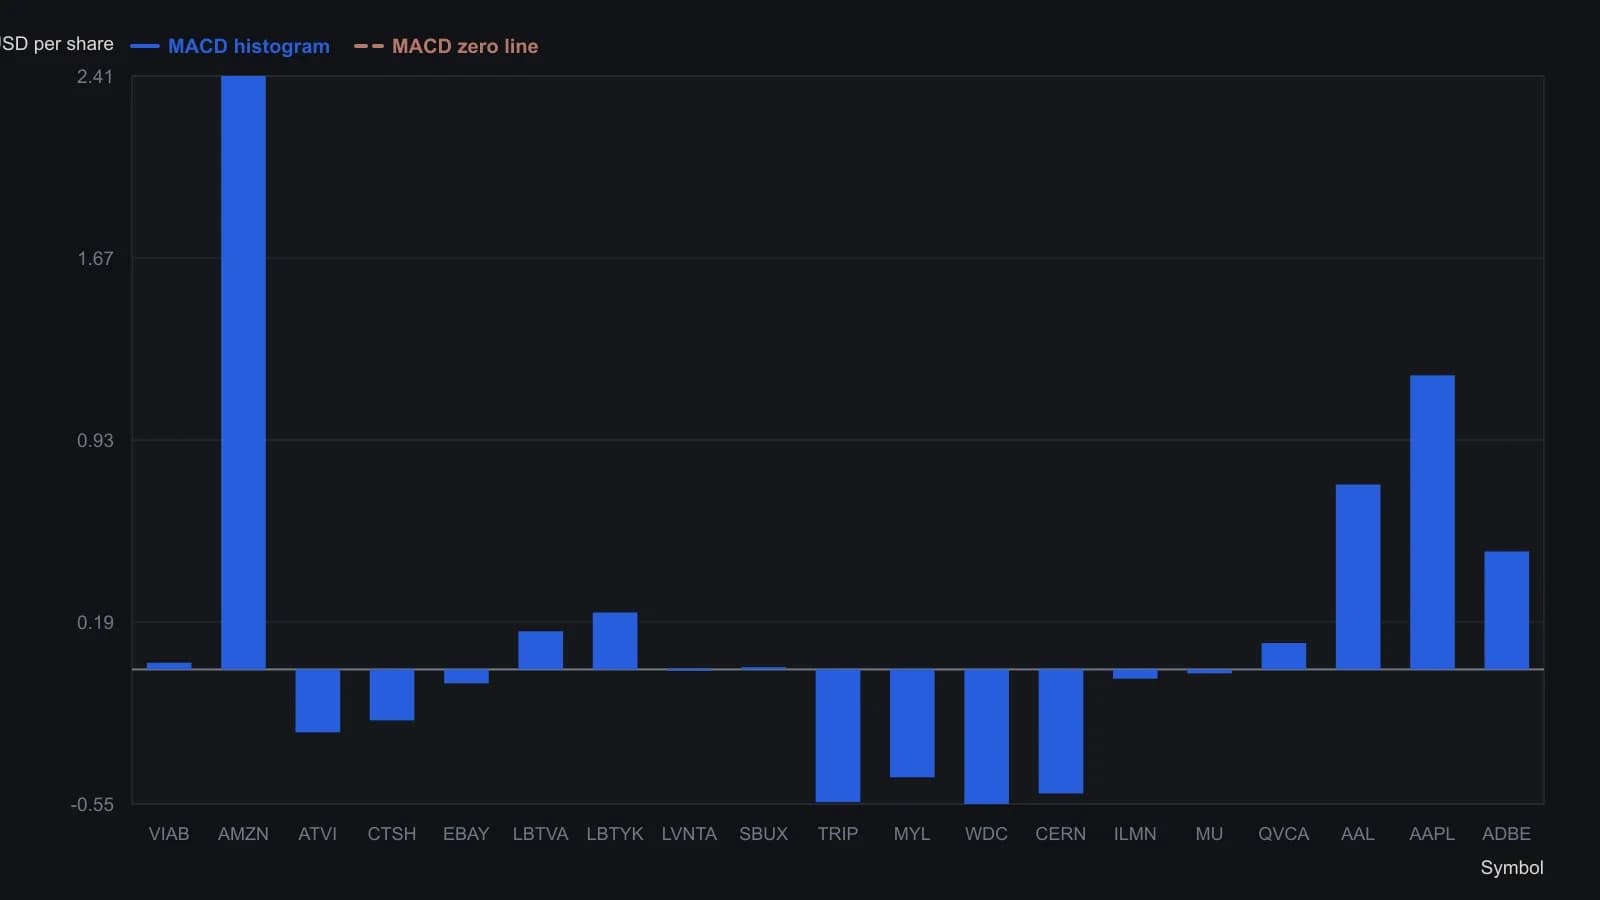
The AIQ port used 34- and 55-bar exponential averages in place of the article’s 34-period weighted average. Histogram values are the 12/26 MACD line, not MACD minus its signal line. WDC is printed Blue in the source table even though its histogram is negative.
How the portable recipe is drawn
One portable recipe paints MACD above zero in one color and below zero in another, then marks a zero-line cross with buy or sell arrows.
Coloring the price-chart background by MACD sign is offered as a way to keep ordinary up-bar and down-bar candle colors visible.
Caution symbols from the slower averages
Editorial terminology: the moving-average layer is a 34-period weighted average and a 55-period exponential average used together as a slower context filter and caution overlay.
Caution symbols are defined when price sits below a 34-period weighted average while still trading above a 55-period exponential average, or when the longer exponential average is above the weighted average and price closes above the weighted average.
Two example readings
A long-only example enters only after price is above the 55-period exponential average and the MACD has already crossed above zero.
A second example treats a price high that is not matched by a lower MACD peak as a fade setup rather than a continuation signal.
A separate Aroon line
Aroon-up and Aroon-down crossovers on a 25-period lookback are presented as a separate line-style alert for trend-change hints.
Editorial terminology: the Aroon indicator is a pair of up and down trend-strength lines whose crossovers supply an independent confirmation or warning of a possible trend change.
Zero cross and the standard signal line
Using MACD with its standard signal line is described as producing many more alerts than using the MACD zero cross alone.
All readings on this track · 5 readings
- 1995Construct the Aroon indicator as a time-since-extreme oscillator
- 1995Building Aroon and RSI-family oscillators from price and time
- 2016Aroon as a time check before a MACD zero-line and moving-average stack
- 2016MACD as a zero-line state map with average and Aroon filters
- 2016Stacking a MACD zero-line cross with Aroon and moving-average filters