1995issue C091-4
Building Aroon and RSI-family oscillators from price and time
Oscillator construction splits into the series being scored and the smoother applied to that score. Editorial reading: an Aroon pair and an RSI-style volatility index share a 0-100 scale but ask different questions: how recently a swing printed, and how one-sided recent volatility has been.
- A relative-volatility index patterned on the relative strength index places a 10-bar closing standard deviation in the up bucket when the close rises and in the down bucket when the close falls, then exponential-smooths each bucket over 14 bars and scales the up share to a 0-100 reading.
- A revised reading averages the same construction on highs and on lows, and a 20-bar simple moving average of that reading becomes an inertia line displayed with a horizontal reference at 50.
- Aroon up and Aroon down convert bars since the lookback high and lookback low into 0-100 time-since-extreme readings, using a default lookback of 25 bars that can be changed to test other horizons.
- The Aroon oscillator equals Aroon up minus Aroon down and can be written directly from the two time-since-extreme counts. Both the Aroon pair and the inertia line are plotted against a 50 midpoint.
Score and smoother as interchangeable parts
Editorial reading: oscillator construction can be treated as two interchangeable parts, the series being scored and the smoother applied to that score. The scored series may be the close, the high and the low, or a count of bars since an extreme. The smoother may be an exponential moving average inside a directional bucket, or a simple moving average of an already finished oscillator.
Editorial reading: placing an Aroon pair beside an RSI-style volatility index shows how the same 0-100 scale can answer two different questions: how recently a swing printed, and how one-sided recent volatility has been.
A relative-volatility index on the RSI pattern
The relative-volatility construction patterned on the relative strength index places a 10-bar closing standard deviation in the up bucket when the close rises and in the down bucket when the close falls, then exponential-smooths each bucket over 14 bars and scales the up share to a 0-100 reading.
The relative strength index is a 0-100 directional oscillator whose up-versus-down construction is reused here on volatility instead of raw price change, with a coded exponential smoother standing in for the original hand-update method. The relative-volatility index is that RSI-shaped reading: it puts a short-window closing standard deviation into the up bucket when the close rises and the down bucket when it falls, then reports the smoothed up share on a 0-100 scale.
Highs, lows, and a slower inertia line
A revised relative-volatility reading averages two copies of the same construction, one driven by highs and one driven by lows, instead of using only the close. The revised relative-volatility index is that average, so the oscillator is not driven only by the close.
An inertia line is defined as a 20-bar simple moving average of the revised relative-volatility reading and is displayed with a horizontal reference at 50. A moving average, in this workflow, is a lookback smoother applied to an already-computed series. The exponential form is used inside the volatility index. The simple form turns that index into a slower inertia line, a slower filter of the revised reading that marks the midpoint of the 0-100 scale.
Inertia and relative-volatility indices, Sep 95 T-bonds
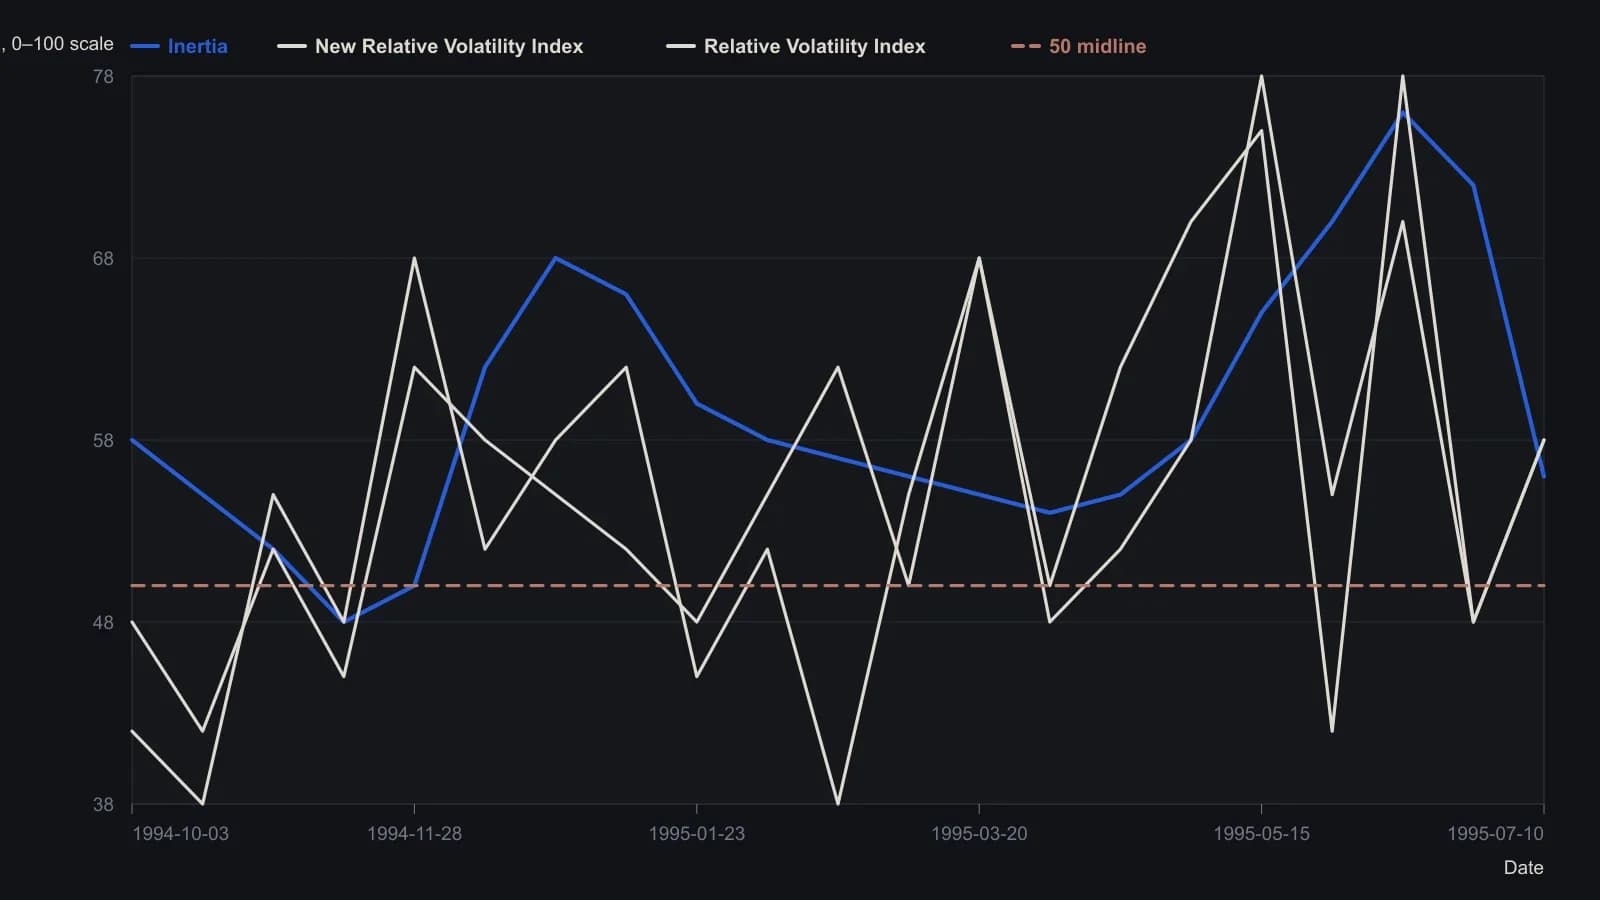
MetaStock tip uses 10-bar standard deviation, 14-bar EMA Wilder-style ratio, and a 20-bar simple moving average for Inertia, with a horizontal line fixed at 50. Digitized from the raster, so levels are approximate.
Time since the lookback high and low
Aroon up equals 100 times (lookback minus bars since the highest high inside that lookback) divided by the lookback. Aroon down uses bars since the lowest low in the same way. The Aroon indicator is a pair of 0-100 lines that convert how many bars have passed since the lookback high and lookback low into a time-since-extreme reading, rather than a price-magnitude reading.
The implementations use a default lookback of 25 bars for Aroon up, Aroon down, and the Aroon oscillator, and treat that length as a coefficient that can be changed to test other horizons.
One line from the two time counts
The Aroon oscillator can be written as 100 times (bars since the lowest low minus bars since the highest high) divided by the lookback, which is an algebraic simplification of Aroon up minus Aroon down. The single line is equal to Aroon up minus Aroon down and can be written directly from the two time-since-extreme counts without first plotting both parent lines.
A shared 50 midpoint
Both the Aroon pair and the inertia line are plotted against a 50 midpoint so readings can be judged relative to the middle of the 0-100 scale.
All readings on this track · 5 readings
- 1995Construct the Aroon indicator as a time-since-extreme oscillator
- 1995Building Aroon and RSI-family oscillators from price and time
- 2016Aroon as a time check before a MACD zero-line and moving-average stack
- 2016MACD as a zero-line state map with average and Aroon filters
- 2016Stacking a MACD zero-line cross with Aroon and moving-average filters