1995issue C091-15
Construct the Aroon indicator as a time-since-extreme oscillator
Aroon-up and Aroon-down scale how recently an x-bar high or low occurred inside a chosen lookback, reaching 100 on a new extreme and 0 when the lookback elapses without one. This article shows how to assemble the two lines, take their difference as the oscillator, and read freshness tests that support a trend-following or a range hypothesis.
- Aroon-up and Aroon-down reach 100 on a new extreme and reach 0 when the lookback elapses without one.
- A 25-bar reference is an arbitrary monthly-scale default; any lookback may be used, and the oscillator is the difference of the two lines.
- The last component to print 100 is the first directional cue, while parallel decline toward zero marks consolidation.
- The same pair of lines can support a trend-following hypothesis when they stay polarized near 100 and 0, or a range hypothesis when they decay in parallel.
What the two lines measure
Aroon-up and Aroon-down scale how recently an x-bar high or low occurred inside a chosen lookback. Each line reaches 100 on a new extreme and reaches 0 when the lookback elapses without one.
Lookback and the oscillator
A 25-bar reference is an arbitrary monthly-scale default. Any lookback may be used. The oscillator is the difference of the up and down lines.
Directional cues and consolidation
The component that last printed 100 is the first directional cue. A later 100 print after a pause can be treated as a breakout hypothesis.
Parallel decline of both lines toward zero marks consolidation. A new-high 100 print while the down line stays near zero is a short-horizon continuation setup.
Momentum warning and shock test
A drop of the up line below 50 means about half the lookback has passed since the last x-bar high and is used as a loss-of-upside-momentum warning.
A jump of the up line to 100 after a gap, followed by the down line falling below 50, is a construction test for whether a one-bar shock is becoming a durable regime shift.
Trend and range hypotheses
The same pair of lines can support a trend-following hypothesis when they stay polarized near 100 and 0, or a range hypothesis when they decay in parallel.
Aroon-up and Aroon-down on June 1995 Canadian dollar futures
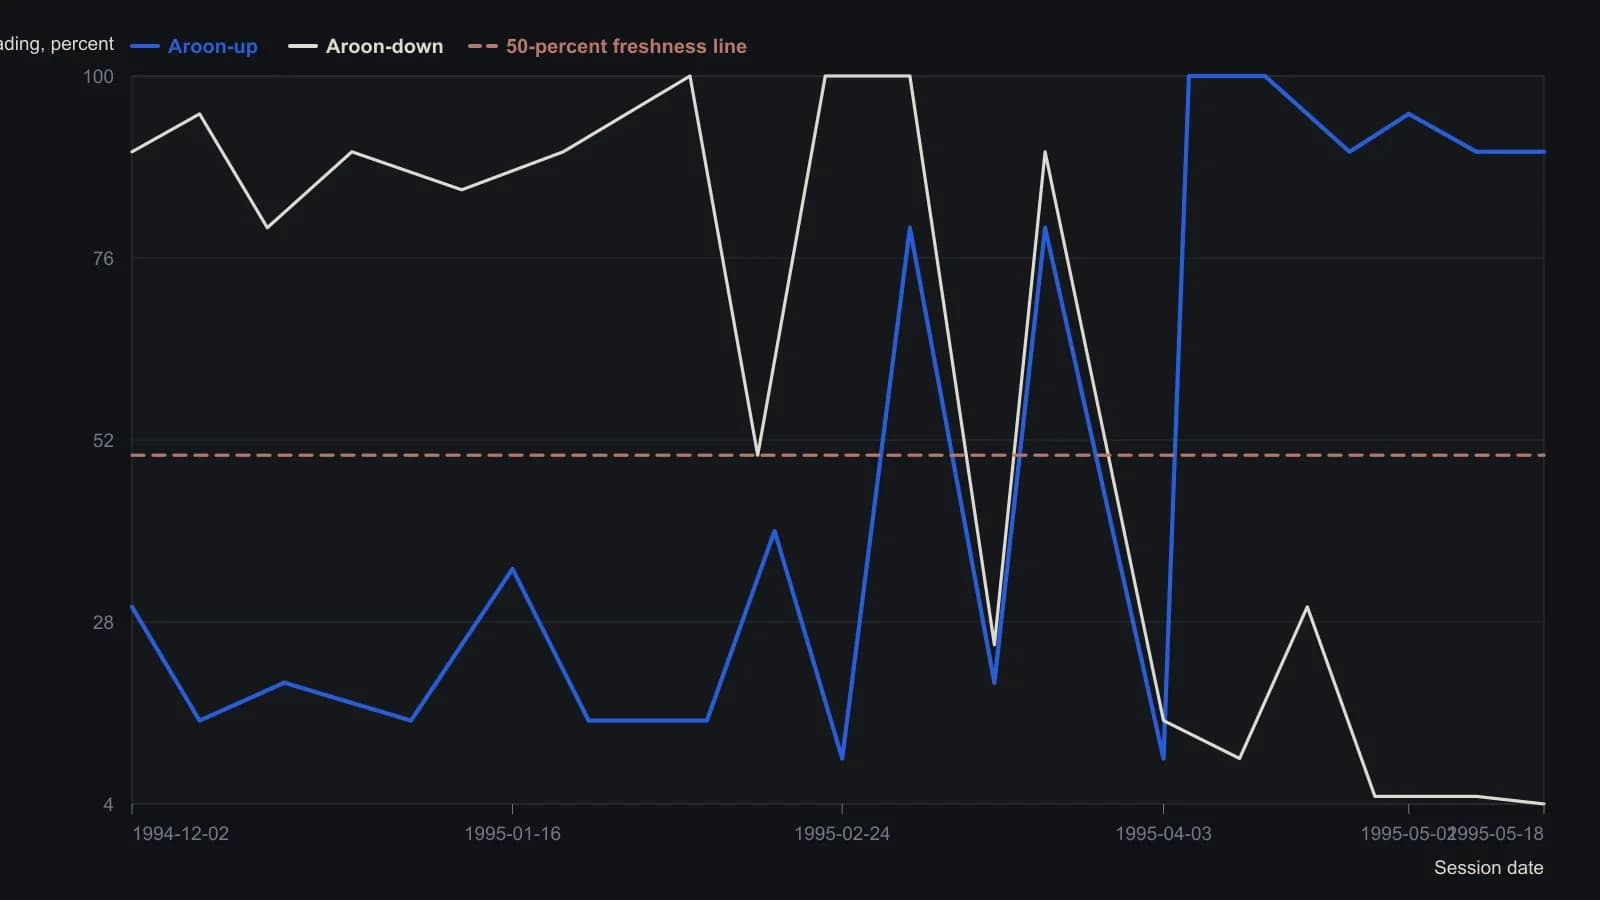
Chande used a 25-session lookback. Turning points are digitized from the plotted pane (grid at 30/50/60/90) and are reliable to about five Aroon points, except the 18 May 1995 close, which is quoted on the chart.
All readings on this track · 5 readings
- 1995Construct the Aroon indicator as a time-since-extreme oscillator
- 1995Building Aroon and RSI-family oscillators from price and time
- 2016Aroon as a time check before a MACD zero-line and moving-average stack
- 2016MACD as a zero-line state map with average and Aroon filters
- 2016Stacking a MACD zero-line cross with Aroon and moving-average filters