2007issue C111-5
Constructing a Heikin-Ashi volume-price oscillator
Assemble a short-horizon buy-sell oscillator from Heikin-Ashi direction, capped volume, and a minimum price-change filter so reversal points stay alerts for chart inspection rather than sole entry or exit commands.
- Build the oscillator to show clear reversal points and to react quickly on the entry side so an initial protective stop can sit closer to the signal price.
- Treat a lower-boundary turn up or an upper-boundary turn down as an alert to inspect the chart with other technical tools, not as a sole entry or exit reference.
- Volume-price analysis adds volume in an uptrend with rising price and volume, subtracts volume in a downtrend with falling price and rising volume, and ignores declining volume during consolidation.
- Cap volume extremes, admit volume only after a Heikin-Ashi price-change cutoff, scale the sum toward a plus or minus 10 range, and read turns against moving standard-deviation bands.
Purpose of the oscillator
A buy-sell oscillator is constructed to show clear reversal points and to react quickly on the entry side so an initial protective stop can sit closer to the signal price.
The oscillator is framed as an alert to inspect the chart with other technical tools, not as a sole entry or exit reference. Illustrated ideal signals occur when the oscillator reaches a lower boundary and turns up, or reaches an upper boundary and turns down.
Volume-price construction
Start with Volume-price analysis. Add volume in an uptrend with rising price and volume. Subtract volume in a downtrend with falling price and rising volume. Ignore volume when volume is declining during consolidation.
Heikin-Ashi direction
Short-term price direction comes from Heikin-Ashi recalculated closes, then those closes are smoothed with a short triple exponential moving average so conventional moving-average lag is reduced.
Volume caps, price-change filter, and scale
Volume extremes are capped at twice a lagged medium-term simple moving average of volume before the oscillator uses that series.
Volume enters the oscillator only after the Heikin-Ashi close exceeds a minimum percentage price-change cutoff, so low-conviction bars such as dojis can be excluded.
The summed price-volume result is divided by a medium-term average of volume so the oscillator scale stays near a readable plus or minus 10 range.
Moving bands and default settings
Oscillator extremes are not fixed levels, so standard-deviation bands around the mean are used as moving upper and lower references.
Default construction settings shown are an 8-bar period, a 1 per-thousand minimum price change, high and low deviation multipliers of 1.5 and 1.3, and a 100-bar deviation window.
SVAPO on Dow Chemical with moving deviation bands
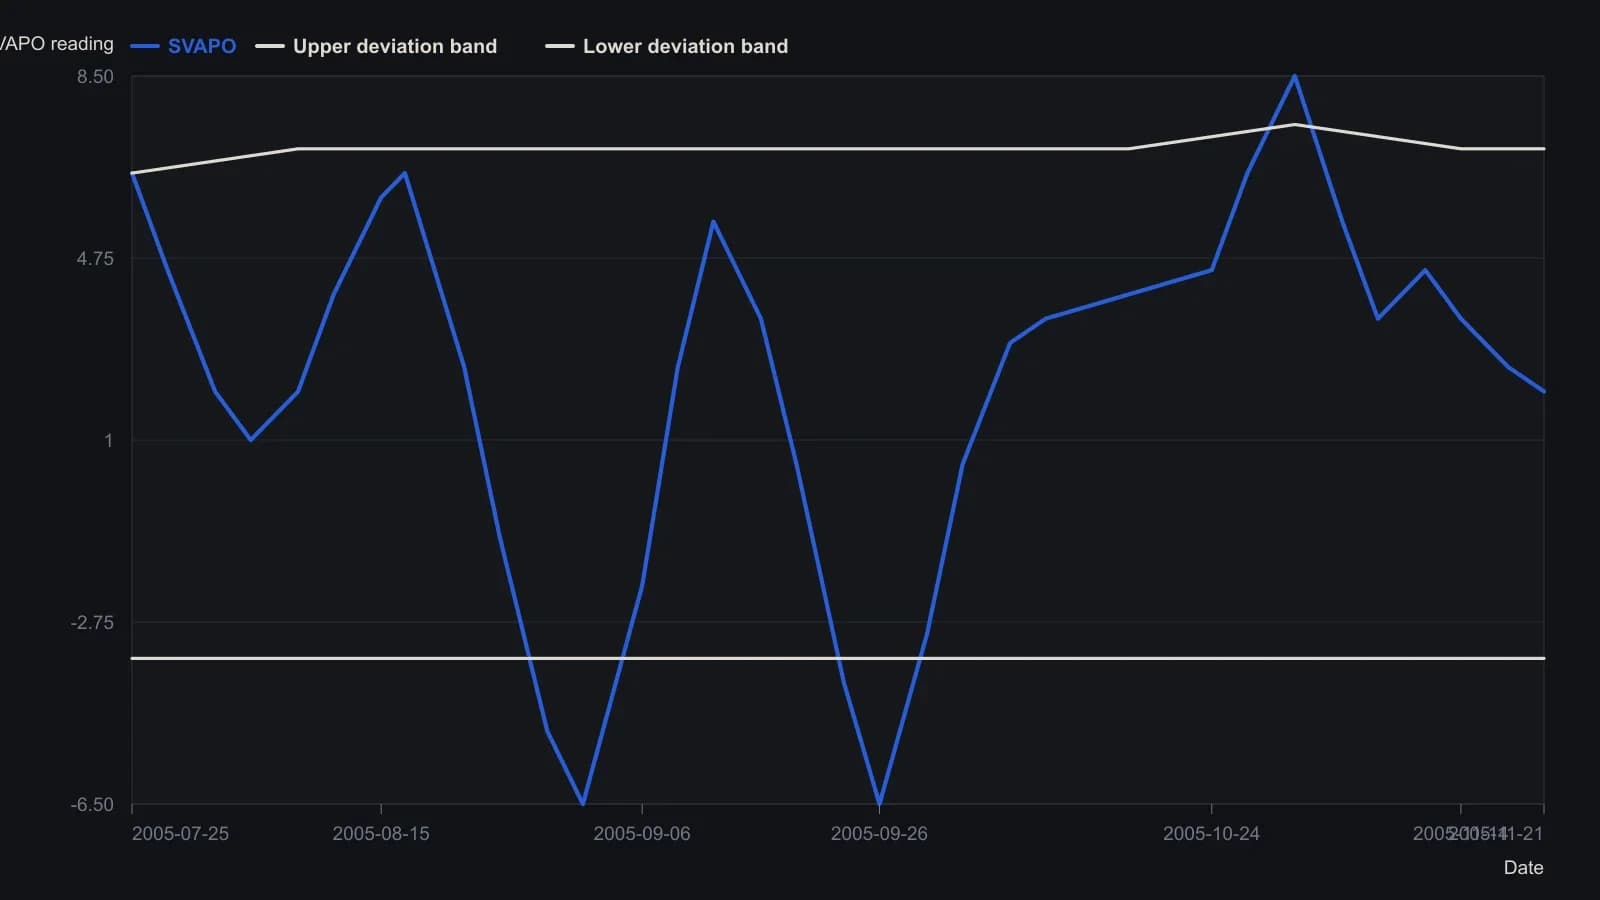
Approximate readings from the published pane (scale ±10, about half a grid unit). Dates follow the weekly axis ticks on the 2005 session calendar, including the 6 September print after the Labor Day close. Source defaults: SVAPO period 8, minimum price change 1 per thousand, deviation 1.5 high and 1.3 low over 100 bars.
Editorial reading
Editorial: The archive describes a construction workflow, not a finished trading system. Money Flow Index can sit beside this oscillator as one of the other technical tools used when a boundary turn appears, so the Heikin-Ashi volume-price alert stays a hypothesis to check rather than a command.
All readings on this track · 16 readings
- 2004Reconstructing Heikin-Ashi bars from smoothed OHLC
- 2004Heikin-Ashi candle construction as an OHLC transform
- 2004Stacking heikin-ashi, swing charts, and a moving average in strong trends
- 2007Constructing a Heikin-Ashi volume-price oscillator
- 2007A volume-price oscillator is a timing trigger, not a standalone entry
- 2008Heikin-Ashi OHLC construction and simplification
- 2008How a Heikin-Ashi candlestick oscillator is built from color, lag, and hold rules
- 2008Heikin-Ashi color-coded candles and smoothed trend filters
- 2010Heikin-Ashi smoothed percent b for divergence timing
- 2011Constructing Heikin-Ashi, moving-average, and MACD filters
- 2011Constructing candlestick, Elliott-wave, and Heikin-Ashi hypotheses
- 2012Constructing a three-state Heikin-Ashi trend filter
- 2012Heikin-ashi as a trend-state signal without candlestick-patterns
- 2013Heikin-Ashi volume gates, smoothing, and denominator floors
- 2013How Heikin-Ashi close and typical-price form a two-average crossover
- 2013Walk-forward tests for color-coded Heikin-Ashi crosses