2010issue C0540-44
Heikin-Ashi smoothed percent b for divergence timing
A historical workflow treats Bollinger Bands as a volatility map and a lag-controlled percent b series as a timing layer. Regular or hidden price-indicator divergence is then read with oscillator turns while price is still traveling between the outer bands.
- Changing bandwidth on Bollinger Bands is a volatility context rather than a direction rule.
- An unsmoothed percent-b series can print highs, lows, and divergences ahead of price turns, but is too choppy for reliable bar-by-bar timing.
- A Heikin-Ashi averaged close, then further lag control, reduces oscillator noise with only a small added delay before percent b is computed.
- Hidden divergence is read as continuation and regular divergence as a reversal candidate, forming entry and exit hypotheses while price remains between the outer bands.
A historical workflow builds percent b from an envelope of Bollinger Bands, steadies that series with Heikin-Ashi and further lag control, and then reads price-indicator divergence while price remains between the outer bands.
Bands as a volatility map
A standard band envelope uses a 20-bar simple moving average as the middle line, with outer bands two closing-price standard deviations above and below that average.
Band width widens when trending prices are more volatile and narrows when prices consolidate nearer the mean, so changing bandwidth is a volatility context rather than a direction rule.
Percent b as a location series
Percent b locates the close between the outer bands and can be scaled from 0 to 100, with readings able to move outside that range when price overshoots the envelope.
An unsmoothed percent-b series can print highs, lows, and divergences ahead of price turns, but remains too choppy for reliable bar-by-bar timing.
Heikin-Ashi smoothing and lag control
Substituting a Heikin-Ashi averaged close for the raw close is the first smoothing change and reduces oscillator noise with only a small added delay.
Further lag control applies an eight-period triple exponential average twice to the Heikin-Ashi series and adds back the difference before percent b is computed.
A later construction variant
A later variant shortens the lookback from 20 to 18 bars, replaces the simple middle average with a weighted average, and applies the triple exponential average to the standard-deviation bands.
Instead of fixed 0, 50, and 100 rails, the finished oscillator is read against bands set 1.6 standard deviations from the 50 line over a 63-bar lookback.
Regular and hidden divergence
Hidden divergence of lower price highs against higher oscillator highs is read as continuation, while regular divergence of lower price lows against higher oscillator lows is read as a reversal candidate.
Regular and hidden divergences, together with clearer oscillator turning points, are used to form entry and exit hypotheses while price remains between the outer bands.
Smoothed percent b on Gaiam’s 2009 rally
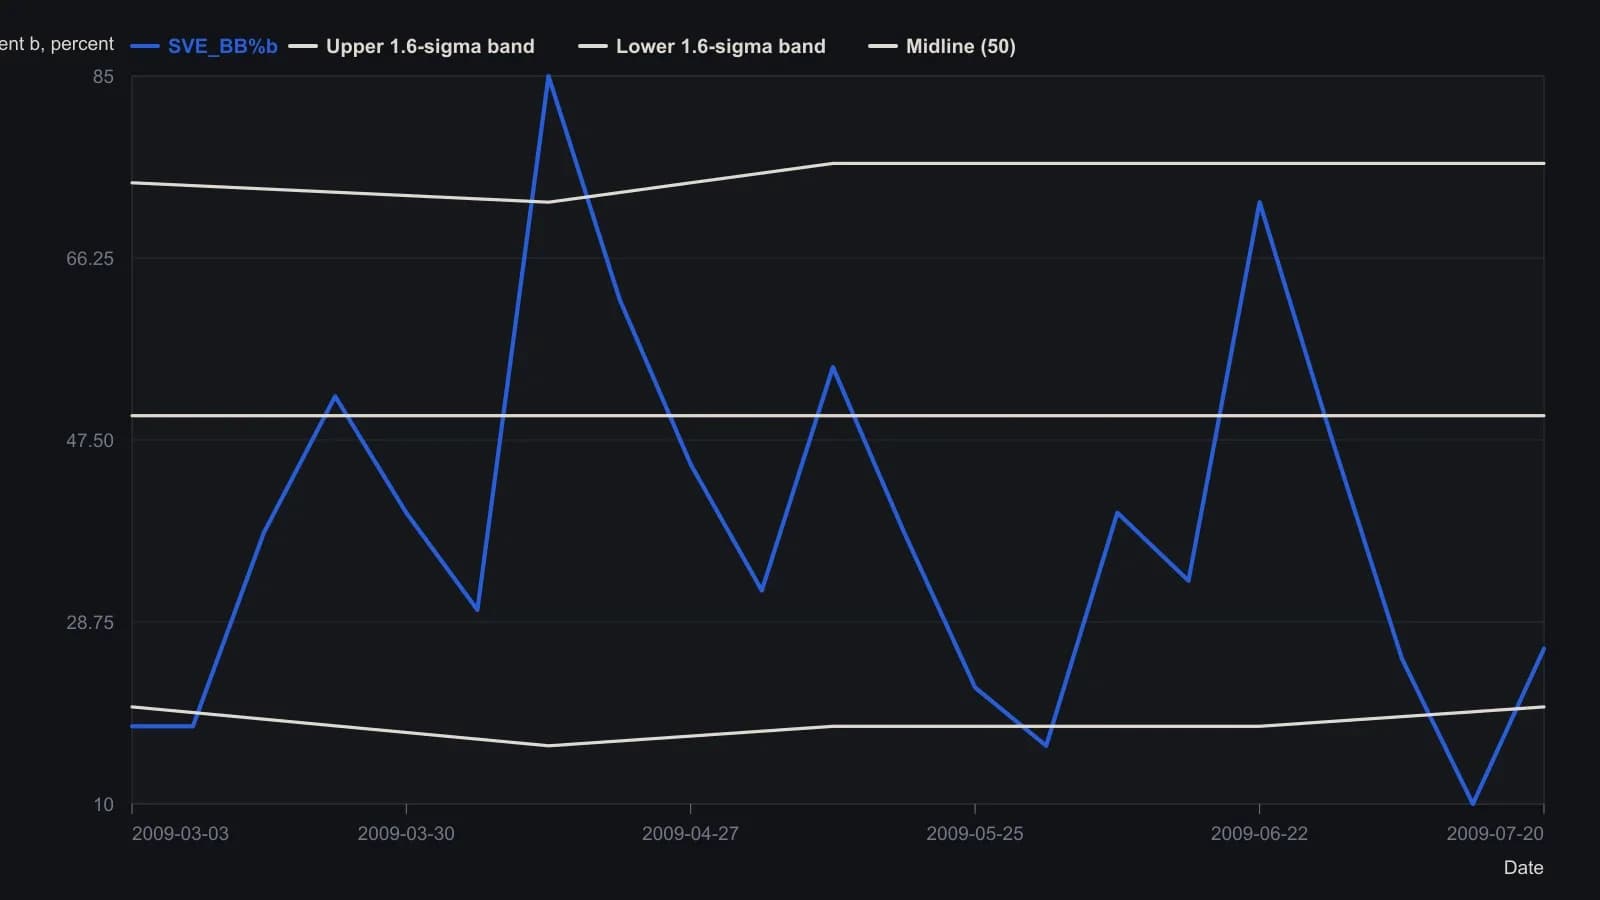
SVE_BB%b is built from Heikin-Ashi closes, an 8-period zero-lag TEMA, an 18-period weighted mid-band, and 1.6-sigma envelopes over 63 days in place of fixed 0/50/100 lines. Digitised weekly from the printed pane; not a tabulated series.
All readings on this track · 16 readings
- 2004Reconstructing Heikin-Ashi bars from smoothed OHLC
- 2004Heikin-Ashi candle construction as an OHLC transform
- 2004Stacking heikin-ashi, swing charts, and a moving average in strong trends
- 2007Constructing a Heikin-Ashi volume-price oscillator
- 2007A volume-price oscillator is a timing trigger, not a standalone entry
- 2008Heikin-Ashi OHLC construction and simplification
- 2008How a Heikin-Ashi candlestick oscillator is built from color, lag, and hold rules
- 2008Heikin-Ashi color-coded candles and smoothed trend filters
- 2010Heikin-Ashi smoothed percent b for divergence timing
- 2011Constructing Heikin-Ashi, moving-average, and MACD filters
- 2011Constructing candlestick, Elliott-wave, and Heikin-Ashi hypotheses
- 2012Constructing a three-state Heikin-Ashi trend filter
- 2012Heikin-ashi as a trend-state signal without candlestick-patterns
- 2013Heikin-Ashi volume gates, smoothing, and denominator floors
- 2013How Heikin-Ashi close and typical-price form a two-average crossover
- 2013Walk-forward tests for color-coded Heikin-Ashi crosses