1996issue C051-9
Evaluating event-day range breakouts in bonds
Bond-market event days can be coded as a range breakout signal or left in an abstention band. Short holding-period windows and reversal windows are then tested against the same buy-and-hold baseline, with opposite-direction follow-through kept as a seasonal-pressure check.
- Event-driven bond signals are taken from the market reaction on the event day, not from whether a release beat or missed a consensus forecast.
- A close in the extreme fifth of the event-day range is a range breakout signal; a close in the abstention band produces no trade.
- One- through five-day holding-period windows and reversal windows are checked against a buy-and-hold baseline with a t-test.
- Opposite-direction follow-through after an event-day breakout is treated as an anomaly, with a seasonal overlay listed as one candidate cause.
A single evaluable procedure
The working hypothesis is that a delayed market response to new economic information can last long enough to be tested as a systematic entry after the release. The event day is the session on which a scheduled economic release is published, and it is labeled day 0 in the holding-period calendar.
Event-driven trading, the breakout system, and seasonal trading are taught here as one bond-market procedure. Classify the event-day close as an extreme-range entry or a middle-range stand-aside. Then test short holding-period windows and reversal windows against the same baseline.
How the event-day close is classified
Event-driven bond signals are defined from the market’s own reaction on the event day rather than from whether a report beat or missed a consensus forecast.
A close in the upper 20% of the event-day range is coded as an upside-breakout buy at the close. A close in the lower 20% is coded as a downside-breakout sell. Closes in the middle 60% produce no trade.
The range breakout signal is a close in the extreme fifth of the event-day high-low range, used as the long or short entry instead of a forecast-versus-actual surprise. The abstention band is the middle 60% of the event-day range, where the procedure generates no trade.
Holding-period windows and reversal windows
The evaluation tested one- through five-day holding periods after the event and also tested reversal rules that take the opposite side of the initial reaction.
Release day is day 0 and later sessions are day 1 and day 2. Every entry and exit is on the close, so a 0-3 window enters on the event day and exits three days later, while a 1-2 window is a one-day hold starting the day after.
A holding-period window is a close-to-close interval defined by entry day and exit day after the release, such as a 0-3 or 1-2 window. A reversal window is a holding period that takes the opposite side of the event-day breakout in order to test fade behavior after the first reaction.
How the check was specified
The procedure was examined on six years of daily bond-futures prices from 1989 through 1994 against a list of monthly economic releases. A t-test was specified as the check for whether a holding period differed from a buy-and-hold baseline.
The same holding-period rules were later examined on 1995 data as a subsequent check of the 1989-94 design.
Seasonal pressure after the first reaction
Opposite-direction follow-through after an event-day breakout was treated as an anomaly, with seasonal pressure after some releases listed as one candidate cause. A seasonal overlay is a candidate explanation that calendar-month rate pressure, not the release itself, may dominate some post-event holding periods.
Editorial interpretation: keep that opposite-direction follow-through inside the same procedure as a seasonal-pressure check. Do not set it aside as leftover noise.
1995 monthly P&L of the combined T-bond event-breakout book
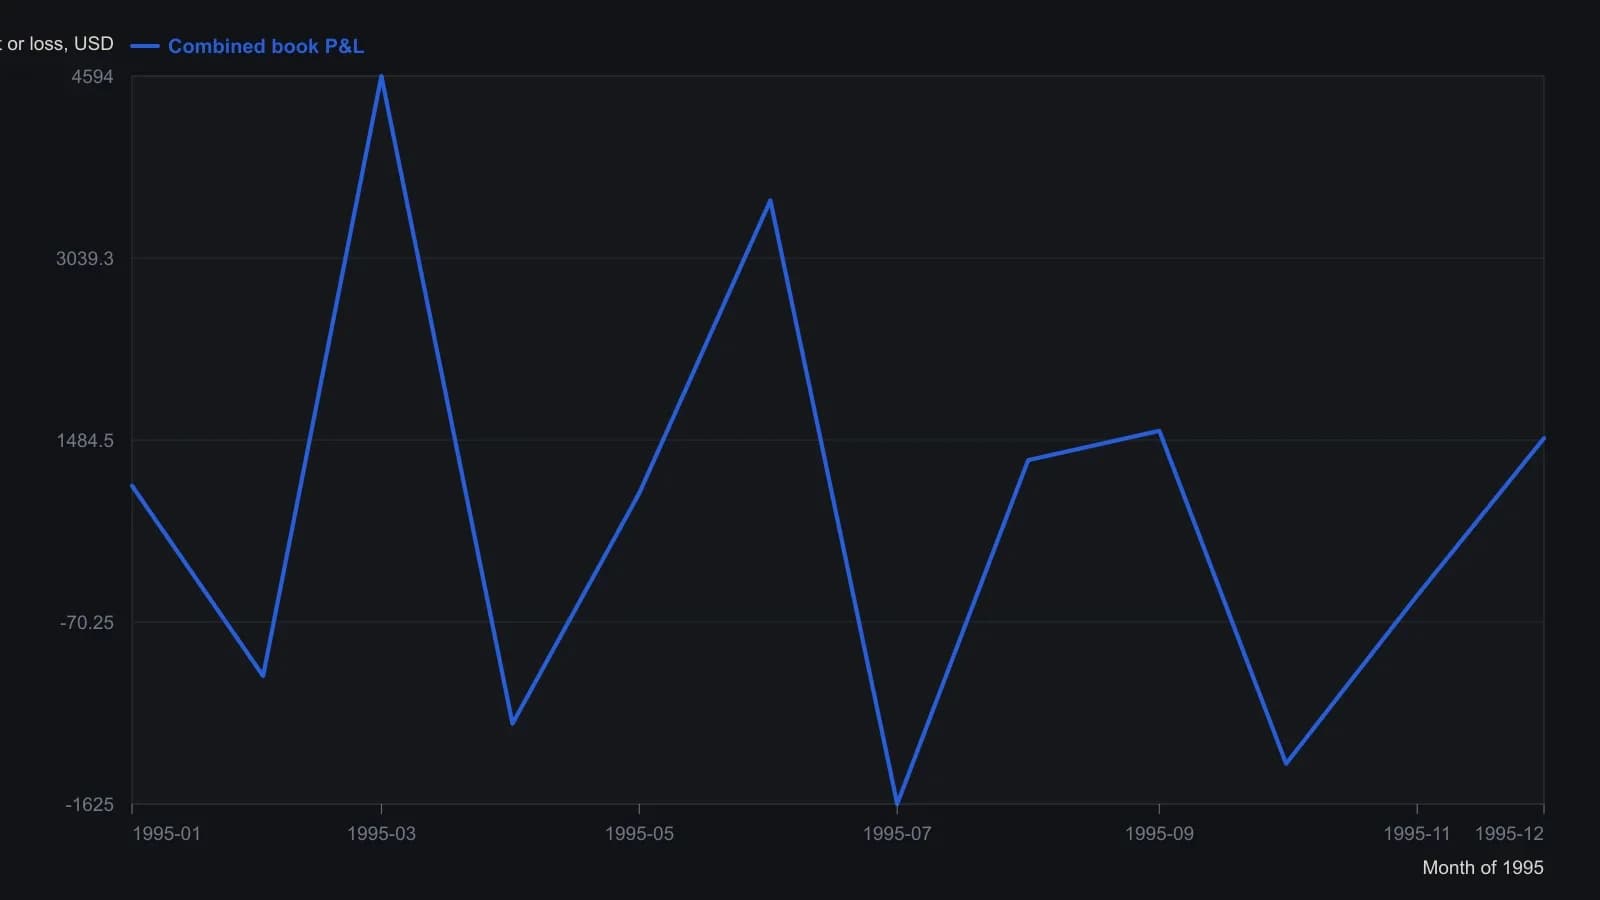
Warwick stacked every listed buy and sell window into one book. 1995 was a strong bond uptrend, so most of the gain came from the long side.