1991issue C051-2
Binomial counts for unrelated position construction
A complementary success rate and failure rate can be expanded across a fixed number of unrelated positions to list every discrete win-loss count. An editorial reading treats name count as a construction variable that can be checked before any market forecast is attached.
- A complementary pair of success and failure rates can be expanded across n unrelated positions to list every discrete win-loss count.
- With a success rate of 2/3 and a failure rate of 1/3, a five-position model assigns 0.21 to majority-loss counts, 0.79 to a winning majority, and 0.0041 to all-failure.
- Raising the position count to ten under the same rates lowers the majority-loss probability to 0.077 and the all-failure probability to 0.000017, with a complementary probability of 0.923 of winning or breaking even.
- Editorial reading: diversification increases the number of unrelated positions so that majority-loss and all-failure become less probable, and the same counting procedure remains usable if the count or the rates change.
A discrete count of unrelated positions
A complementary pair of success and failure rates can be expanded across n unrelated positions to list every discrete win-loss count. The success rate is the assumed chance that one unrelated position finishes as a winning outcome. The failure rate is the assumed chance that one unrelated position finishes as a losing outcome.
When five unrelated positions are modeled, the expansion coefficients for zero through five successes are 1, 5, 10, 10, 5 and 1.
Five-position probabilities
With a success rate of 2/3 and a failure rate of 1/3, the five-position model assigns 0.21 to counts in which failures outnumber successes. Those counts are the majority-loss outcomes. Under those same five-position rates, the complementary probability of a winning majority is 0.79.
The five-position all-failure probability is 0.0041. All-failure is the single outcome in which every modeled position finishes as a loss.
Raising the position count
Raising the position count to ten under the same rates lowers the majority-loss probability to 0.077 and the all-failure probability to 0.000017. The ten-position complementary probability of winning or breaking even is 0.923.
Editorial reading: diversification is a construction choice that increases the number of unrelated positions so that majority-loss and all-failure counts become less probable under a stated success rate. The same discrete counting procedure remains usable after the position count or the success and failure rates are changed.
Majority-loss outcomes among five unrelated names
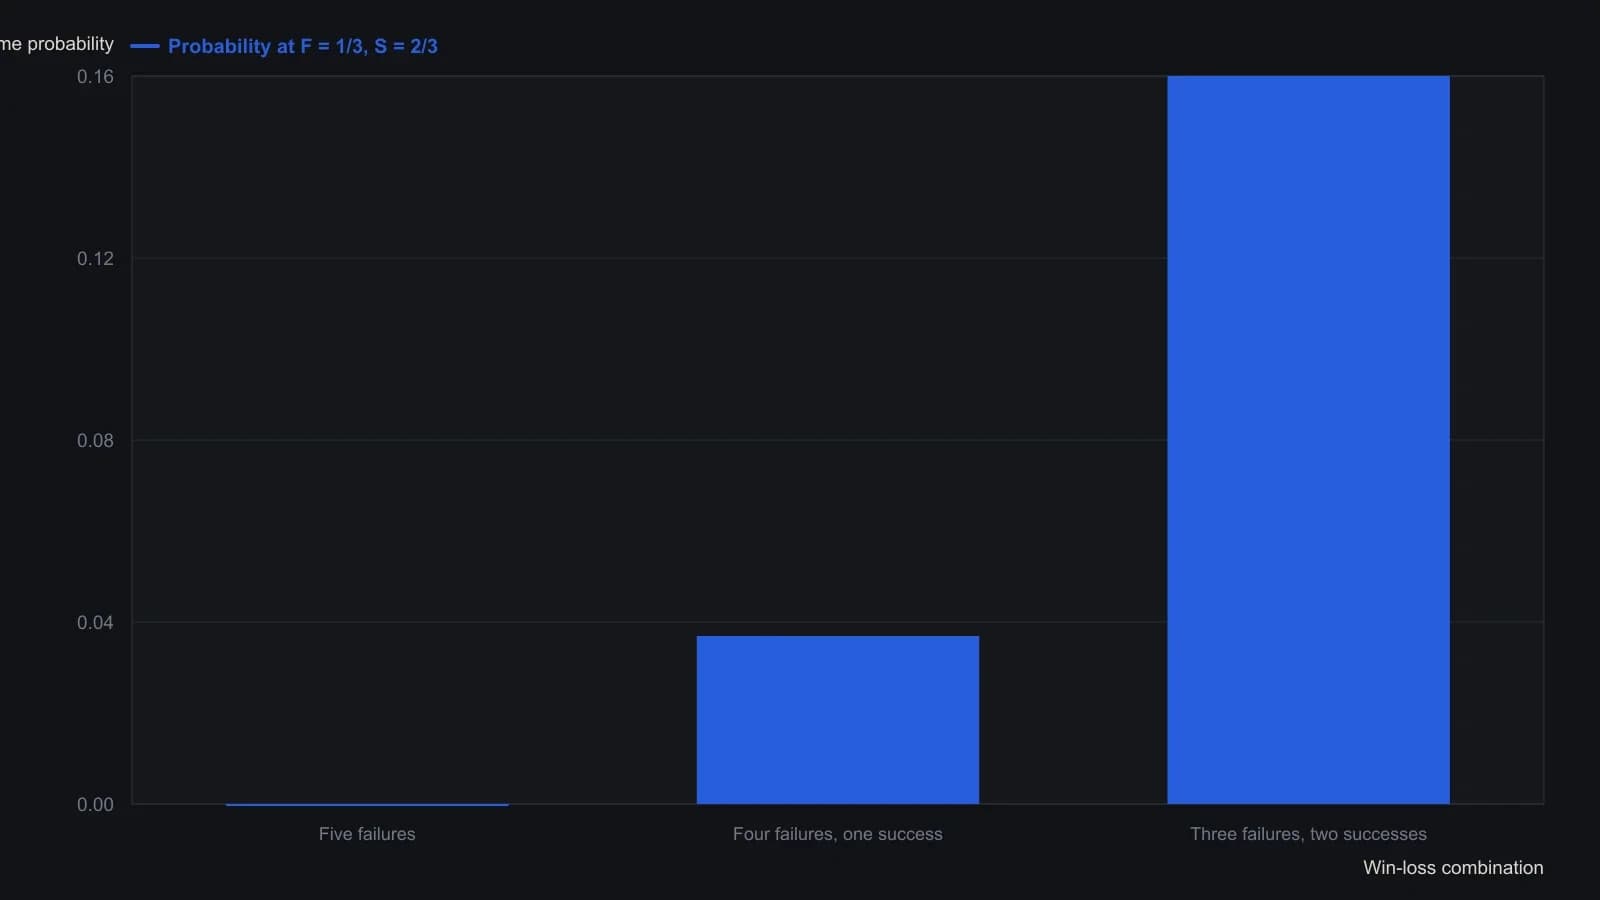
The source fixes failure at one-third and success at two-thirds, treats the names as unrelated, and calls a loss any case where failures exceed successes.
All readings on this track · 7 readings
- 1989Auditing price motifs against binomial chance
- 1991How equal independent stakes change the odds of a complete loss
- 1991Binomial counts for unrelated position construction
- 1996Log-change regression and binomial outlier clusters as an evaluation pipeline
- 1996Constructing a log-change stationarity screen with regression or binomial tests
- 1998Binomial baselines for discount-rate change timing
- 2002Trade-count horizon for equity-curve survival