1998issue C101-3
Binomial baselines for discount-rate change timing
Editorial interpretation: treat elapsed days since the last official discount-rate change as a sampling window, recode the next move for trend-consistency, and only then run a binomial-probability-model against an explicit chance baseline. That sequence shows which elapsed-time-bucket windows contain a directional tilt and which are still a small-sample coin flip.
- Of 113 discount-rate changes recorded from 1934 onward, 59 arrived within 90 days of the previous change.
- Within 90 days of a prior change, 57 of 59 subsequent changes continued the existing direction.
- The 90-to-180-day window held 13 hikes and 6 cuts, and a binomial calculation that used the sample-wide hike rate of 60 out of 113 assigned that tilt an 86.7% confidence-level against a chance explanation.
- Changes arriving 365 to 720 days after the prior move reversed the existing trend 72.7% of the time, while the greater-than-720-day bucket of six events was treated as too small to call.
A sampling window before the test
Editorial interpretation: treat elapsed days since the last official discount-rate change as a sampling window, recode the next move for trend-consistency as continuing or reversing the direction set by the immediately preceding change, and only then run a binomial-probability-model against an explicit chance baseline. That order lets a reader see which waiting windows contain a directional tilt and which are still a small-sample coin flip.
The binomial-probability-model treats each classified rate move as a success or failure against a stated baseline probability and returns the chance of seeing that many successes under the baseline. Moves are first grouped into an elapsed-time-bucket, a fixed day-count interval since the previous official rate change. The confidence-level is the modeled probability that an observed hike-cut or continue-reverse split is not produced by the stated chance baseline.
How later changes clustered
Of 113 discount-rate changes recorded from 1934 onward, 59 arrived within 90 days of the previous change.
Hike and cut counts by waiting window
The 90-to-180-day window held 13 hikes and 6 cuts. A binomial calculation that used the sample-wide hike rate of 60 out of 113 assigned that tilt an 86.7% confidence-level against a chance explanation. Reported confidence figures came from a cumulative binomial probability, illustrated for the 90-to-180-day hike count with 12 of 19 events and a 0.531 baseline hike probability.
Outside the 90-to-180-day window, hike and cut counts were not treated as statistically distinguishable across the elapsed-time categories. The greater-than-720-day bucket contained only six events, four of them hikes, and that count was treated as too small to call the 67% hike share significant.
Trend-consistency after the prior move
Within 90 days of a prior change, 57 of 59 subsequent changes continued the existing direction. Across the full sample, 76.8% of changes continued the existing trend. At an 87% significance threshold every elapsed-time-bucket differed from chance except waits longer than 720 days.
The 0-to-30-day, 30-to-60-day, and 365-to-720-day buckets reached a 99% significance level for the trend-consistency contrast. Changes arriving 365 to 720 days after the prior move reversed the existing trend 72.7% of the time.
Discount-rate cuts and hikes by days since the last change
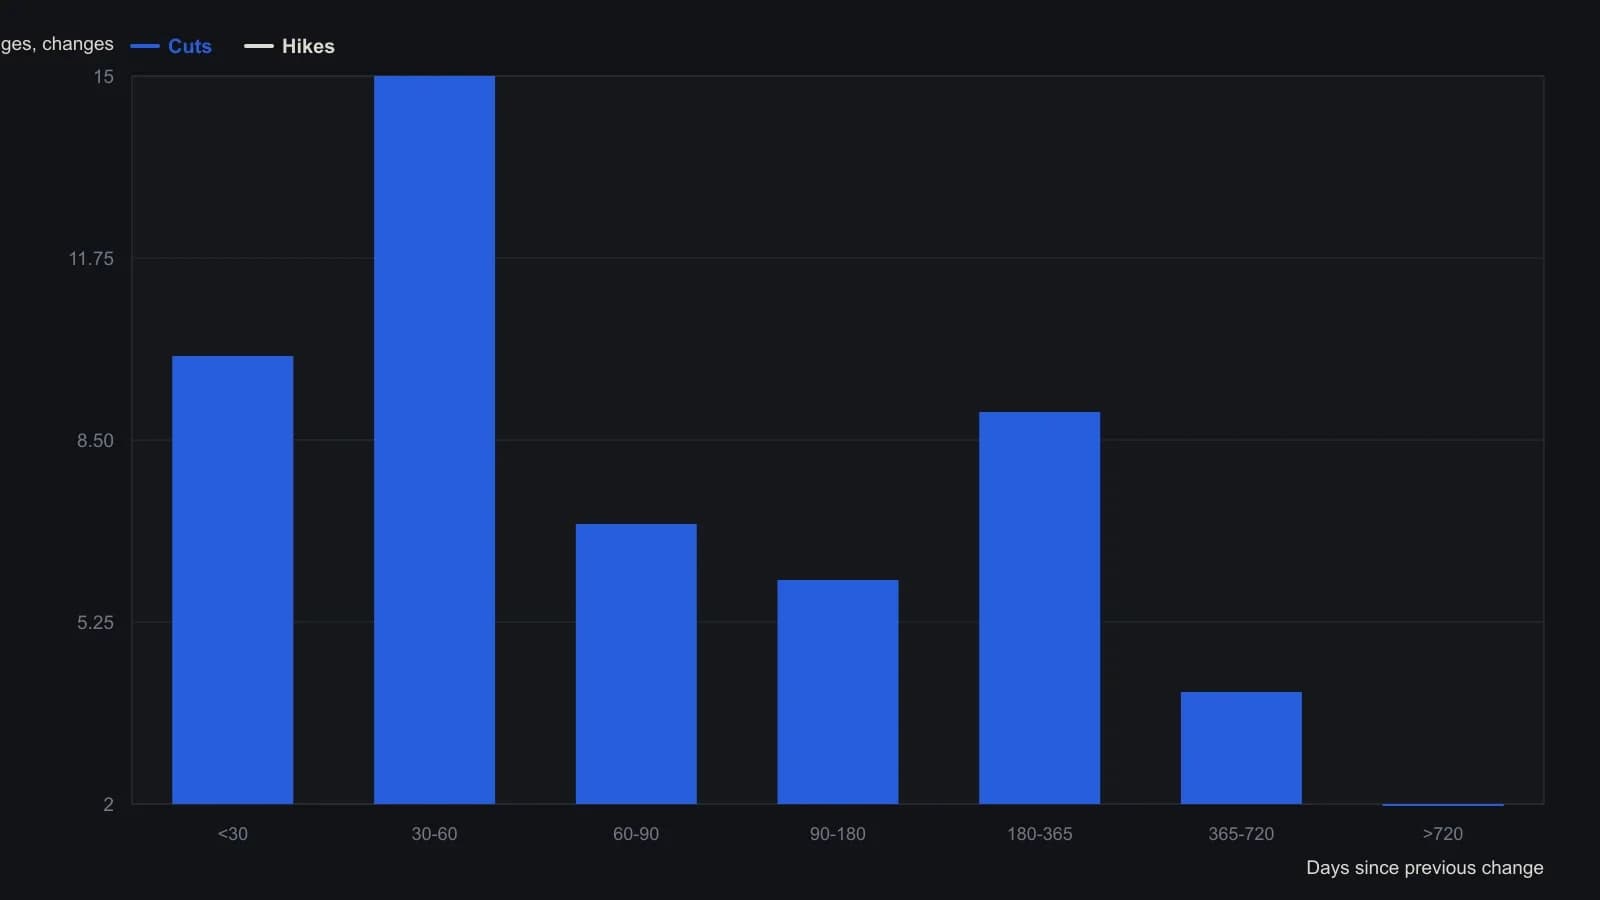
Morris pulled the history from the St. Louis Fed FRED discount-rate series beginning in 1934. He treated hike versus cut as a binomial draw and judged only the 90–180-day split significant, and only at 86.7% confidence.
All readings on this track · 7 readings
- 1989Auditing price motifs against binomial chance
- 1991How equal independent stakes change the odds of a complete loss
- 1991Binomial counts for unrelated position construction
- 1996Log-change regression and binomial outlier clusters as an evaluation pipeline
- 1996Constructing a log-change stationarity screen with regression or binomial tests
- 1998Binomial baselines for discount-rate change timing
- 2002Trade-count horizon for equity-curve survival