1994issue C111-11
Alpha screening and regime-aware portfolio construction
A high-alpha screen isolates monthly return that is independent of the market and ranks names by that residual scaled to 12-month volatility. The archive then rotates fundamental overlays and rebuilds the list as conservative, moderately aggressive, and aggressive sleeves of a worked book.
- A high-alpha screen isolates the part of monthly return that is statistically independent of broad-market return, so a name can look strong on relative strength and still post near-zero or negative alpha.
- Risk in the screen is the standard deviation of monthly returns over the prior 12 months, treated as regime-dependent, and candidates are ranked by alpha divided by that volatility.
- Fundamental overlays are drawn from a tested battery and reweighted on a trailing 12-month performance measure, because which filter is working is allowed to change.
- A worked book dated August 29, 1994 splits holdings into conservative, moderately aggressive, and aggressive sleeves whose average beta, alpha, volatility, mean return, profit margin, and projected P/E rise together.
Editorial framing: a selection list becomes a book
This is an editorial reading of a historical workflow, not a claim the archive itself makes about later markets. Treat the case study as a portfolio-construction problem: isolate the part of return that is independent of the market, scale that residual by changing volatility, then reassemble names into risk-tiered books.
In that editorial frame, Asset allocation is the step that puts a single name into a diversified or regime-aware book. Mean-variance optimization is the quantitative baseline for ranking the residual over a defined lookback and for comparing sleeve averages as intended risk rises.
Isolate return that is independent of the market
A high-alpha screen isolates the portion of a stock's monthly return that is statistically independent of broad-market return. A name can look strong on relative strength while still posting a near-zero or negative alpha if its path simply tracks the market.
As of the illustrated date, a cellular-communications name showed an alpha of 17.59% with a beta of 0.708. The archive presents that path as price action driven more by company-specific merits than by market beta.
Scale the residual by changing volatility
Risk used in the screen is the standard deviation of monthly returns over the prior 12 months. That volatility is treated as regime-dependent rather than constant across sectors or calendar time.
Candidates are ranked by alpha divided by that 12-month return standard deviation. Exceptional names are described at 0.4 or higher, and the typical buy-list cutoff is 0.3 or higher.
Stack filters that are allowed to rotate
The automated alpha screen is then stacked with a rotating subset of fundamental filters: sales growth, projected rather than trailing earnings growth, analyst revisions, standardized unanticipated earnings, and high but still-expanding profit margins.
Those filters are chosen from a larger tested battery of 23 models, of which seven were in active use. The stacked screens are themselves reweighted on a trailing 12-month performance measure, because which fundamental filter is working is allowed to change through time.
Rebuild the names as risk-tiered sleeves
A worked $10,000 book dated August 29, 1994 is split into conservative, moderately aggressive, and aggressive sleeves. The primary objectives step from minimizing expected risk to accepting more risk for higher expected return.
Across those three model sleeves the tabulated averages rise together: beta from 1.059 to 1.293, alpha from 4.6% to 6.1%, return standard deviation from 10.6% to 13.1%, mean return from 5.9% to 7.7%, profit margin from 5.2% to 6.3%, and projected P/E from 17.3 to 21.8.
Holdings added to the illustrated book at different months still carry positive measured alphas as of August 26, 1994, including 6.47%, 2.02%, 10.34%, 5.10%, 8.17%, and 2.85% on the six named additions.
Cellular Communications weekly price, late 1993–1994
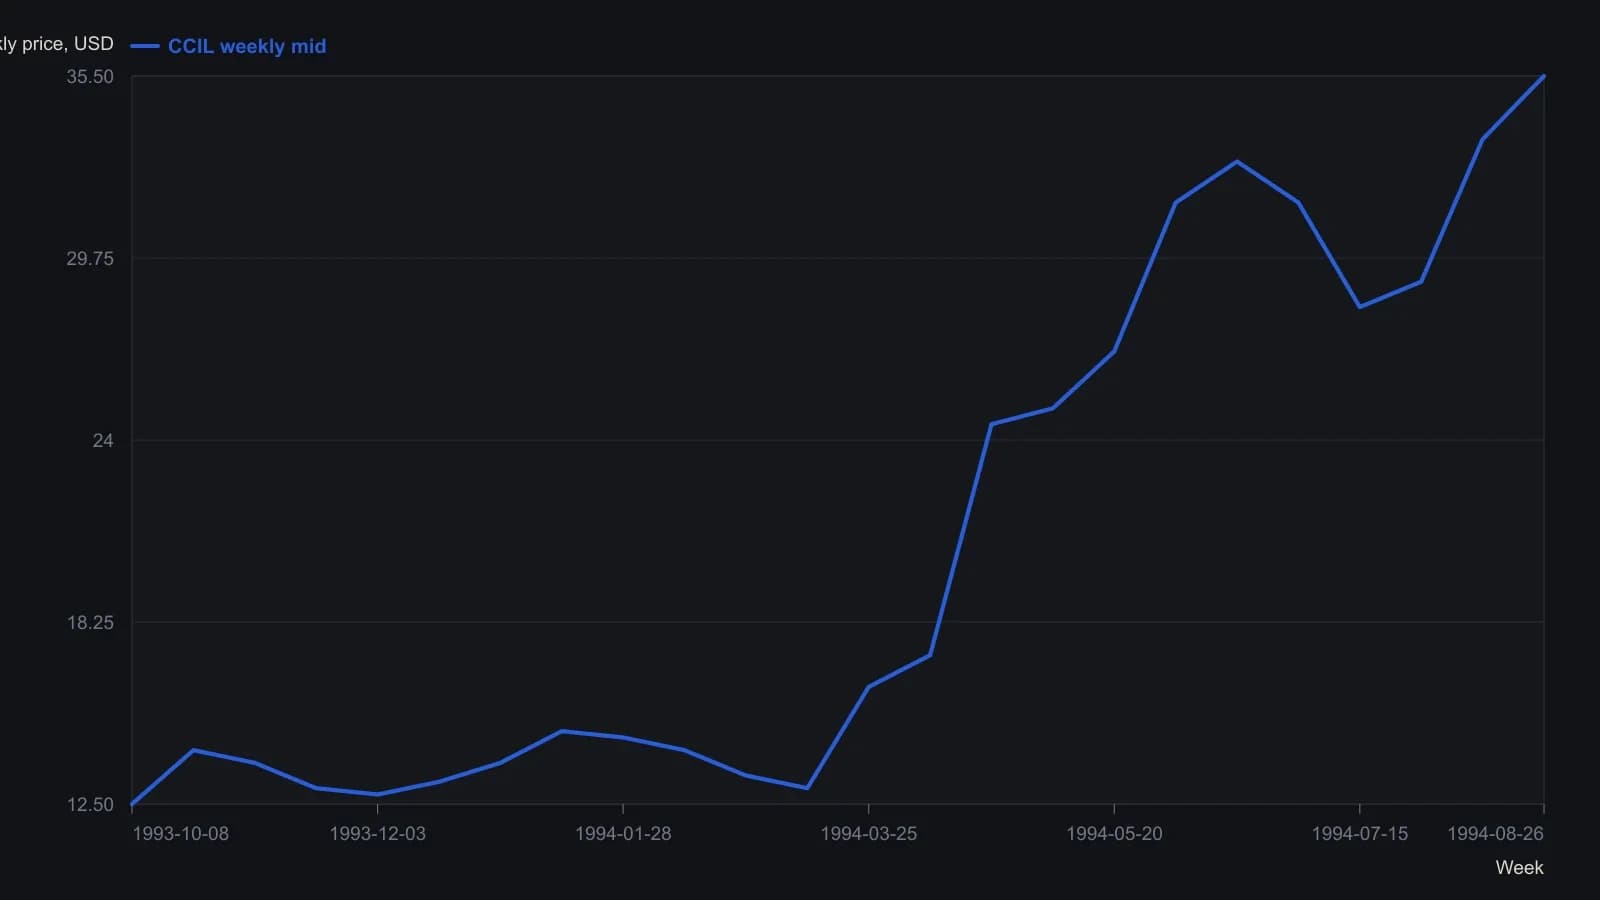
Digitized from the weekly high-low range chart. Midpoint of each bar is used as the plotted y; no more precision than the raster supports. Volume pane not recovered. Source also states alpha 17.59% and beta 0.708 as of 26 Aug 1994.
All readings on this track · 6 readings
- 1990Implied economic forecasts from factor portfolio construction
- 1994Alpha screening and regime-aware portfolio construction
- 2007Sizing a trend sleeve with a risk-aversion sweep
- 2010Portfolio construction as a pipeline: a 2010 classroom case
- 2013Classroom books, leftover beta, and diversification
- 2015Two layers for a managed-futures sleeve in a stock-bond mix