1993issue C011-11
Evaluating downside shortfall versus variance and beta
A classroom audit of whether variance, index beta, and a below-target shortfall score still agree after upside observations are dropped, a personal return floor is set, and risk attitude is allowed to differ.
- Variance and index beta score large positive deviations as risk, even though above-expected or above-market outcomes are treated as desirable.
- Lower partial moment averages only shortfalls below a chosen target and replaces every observation above that floor with zero.
- Beta is limited to diversified books of more than 15 securities; individual names are ranked by dividing period mean return by lower partial moment.
- Two series that share a mean and a variance can reverse their lower-partial-moment order as the degree n moves from risk-seeking through risk-neutral to risk-averse.
Risk as a miss versus a forecast
Risk is defined as the chance that realized return differs from a forecast expected return. A held-to-maturity short government bill is offered as the near-certainty case.
The two-moment ranking rule
Mean-variance optimization is a two-moment ranking rule that prefers lower variance at a given expected return and higher expected return at a given variance. The comparison prefers the smaller variance when expected returns are equal and the larger expected return when variances are equal.
Variance is the squared average deviation of period returns from expected return. It is a two-sided width of the return distribution and is described as most accurate on symmetric return distributions.
When variance treats upside as harm
Variance can assign equal risk to two series that share a mean and a variance but differ in the direction of skewness. Skewness is asymmetry of the return distribution, so equal mean and variance need not imply equal downside exposure.
Both variance and index beta score large positive deviations as risk, even though above-expected or above-market outcomes are treated as desirable rather than harmful.
Beta as a market slope
Index beta is the slope of a security-versus-market regression. A slope of 1.0 is market-like volatility, a slope below 1.0 is quieter than the index, and a slope above 1.0 is louder. The slope is labeled systematic risk and the residual is labeled security-specific risk.
Systematic risk is market-wide variation that a beta slope is meant to isolate and that diversification does not remove. Unsystematic risk is security-specific residual variation treated as diversifiable once a book holds more than 15 names.
Beta is limited to diversified books of more than 15 securities and is not treated as a valid way to compare individual names, because residual risk remains when the book is smaller.
A return floor instead of two-sided width
Value at risk is a threshold reading of risk: the return floor an investor does not want to breach, against which only below-floor outcomes are scored.
Lower partial moment averages only shortfalls below a chosen target return. Any observation above that floor is replaced by zero, so excess gains do not increase the risk score.
A tolerance dial on shortfall
The lower-partial-moment degree n is used as a tolerance dial. An n below 1.0 is treated as risk-seeking, n equal to 1.0 as risk-neutral, and n above 1.0, often 2.0, as increasingly risk-averse.
Two series that share mean and variance can reverse their lower-partial-moment ranking as n rises. The negatively skewed series looks more attractive only when n is below 1.0, the two are equal at n equal to 1.0, and the positively skewed series dominates as n increases.
Ranking names by reward to shortfall
Individual names are compared by dividing period mean return by lower partial moment rather than by variance. The Sortino ratio is that reward-to-downside comparison when the shortfall measure is second degree.
A numerical illustration uses a 15 percent mean and an n-equals-2 lower partial moment of 5 to produce a reward-to-shortfall ratio of 3. A daily lower partial moment is scaled by 125 to a half-year window without changing the ranking order.
Southwestern Bell versus W.R. Grace on three reward-to-risk ratios
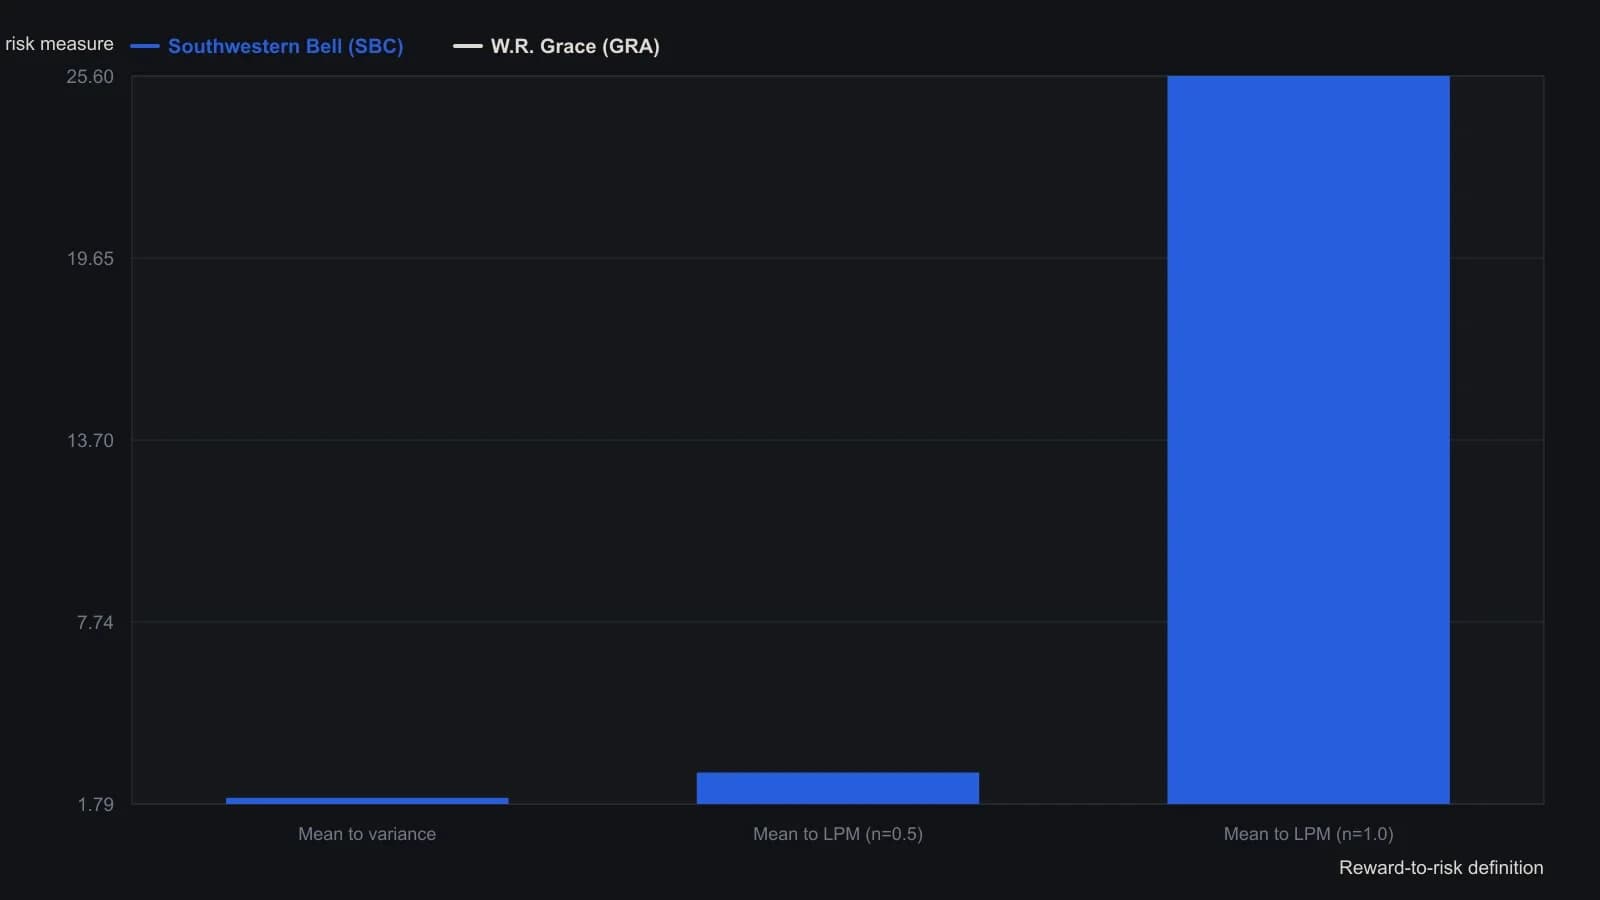
Silver computed LPM on daily returns with target h = 7.5 and multiplied by 125 so the ratio would sit on a semi-annual scale. Mean-to-LPM at n = 2.0 (1515.82 vs 706.15) and n = 3.0 (70714.29 vs 24784.31) still rank Bell first but are left off the bars because those ratios explode as LPM shrinks toward zero.