2002issue C091-3
A wave worksheet of Fibonacci clusters and reversal stars
In this Nasdaq minor-wave walkthrough, each completed swing becomes the measurement base for the next wave. After an actual reversal is entered, a new Fibonacci cluster is generated, and a star candlestick inside that cluster is watched rather than a straight-line path.
- Elliott wave work here ranks relative future price paths from located swing highs and lows rather than claiming a perfect forecast.
- Wave 2 is measured as a Fibonacci retracement of wave 1 from the end of wave 1, with 38.2 percent as a typical first look.
- After each actual reversal is entered, a new and usually larger Fibonacci cluster is generated for the next wave.
- A morning star or evening star inside that cluster is watched before the next wave is retagged, not a straight-line path.
Waves as a ranking tool
Elliott wave work here is the labeling of motive and corrective swings so each completed wave becomes the measurement base for the next. It is presented as an objective way to rank relative future price paths by locating swing lows and highs, not as a perfect forecast.
A swing is used as a measurement base only after the actual reversal has been entered. Until that high or low is locked, the next wave still lacks a finished starting point.
Lock the swing, then build the cluster
Wave 2 is measured as a Fibonacci retracement of wave 1 from the end of wave 1, with 38.2 percent treated as a typical first look. Fibonacci retracement here means percentage pullbacks and extensions of prior waves used to build a cluster of candidate ending prices.
A price cluster is a tight group of independently calculated ratio targets that marks the most probable zone for the current wave to end. After each actual reversal is entered, a new and usually larger Fibonacci cluster is generated for the next wave.
The Nasdaq minor-wave walkthrough
In the Nasdaq minor-wave walkthrough, wave 2 was projected near 3497 on a 38.2 percent retracement of wave 1 and reversed at 3480, a 36.8 percent retracement.
Wave 3 was projected as 100 percent to 161.8 percent of wave 1 from the wave-2 extreme. The earliest listed target was 2257 and the reversal printed at 2251.
Wave 4 was projected as a 38.2 percent to 61.8 percent retracement of wave 3 in a 2720 to 3010 band and reversed at 2892, a 52 percent retracement, while remaining below the wave-1 extreme at 3026.
Wave 5 was first projected as equal to wave 1 at 1659, reversed at 1619 just beyond a 100 percent wave-1 multiple, and was treated as completing the parent intermediate third wave.
Nasdaq weekly reversals through the five minor waves of (3)
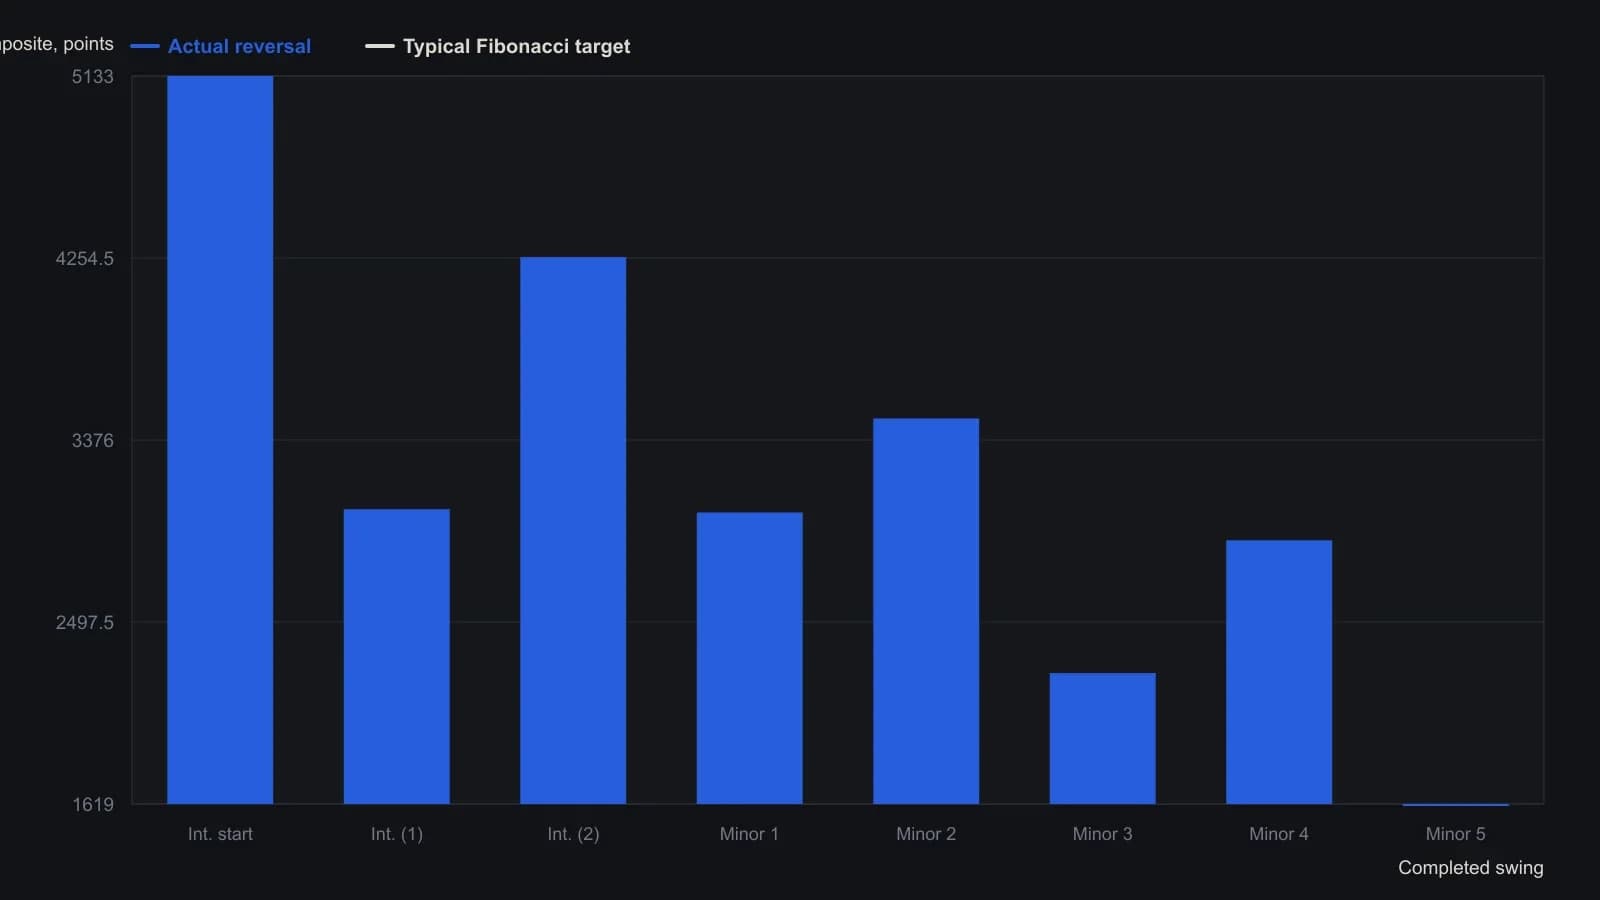
Typical targets are the single prints cited in prose: 38.2% of W1 for wave 2, 100% of W1 for wave 3, and 100% of W1 for wave 5. Wave 4 is left off that reference series because the article only gives the 2720–3010 band.
Stars inside the rebuilt cluster
On the daily chart of that sequence, a morning star marked the wave-1 upside reversal and an evening star marked the wave-2 downside reversal. Candlestick-star work here means those morning-star and evening-star reversal formations are used to time a reaction inside a projected cluster.
Price is watched for a candlestick reversal inside the current cluster rather than for a straight-line path. Once that reversal is entered, the finished swing is locked and the next, usually larger, cluster is built from it.
Degree completion at the fifth wave
Degree completion is the condition that a fifth wave also finishes the parent wave one degree higher. In this walkthrough the fifth wave was treated as completing the parent intermediate third wave, so the locked fifth-wave extreme became the measurement base for work at that higher degree.
All readings on this track · 6 readings
- 2002Constructing engulfing and star patterns from OHLC bars
- 2002A wave worksheet of Fibonacci clusters and reversal stars
- 2004Morning star reversal graded with a stochastic oversold check
- 2005Volume-confirmed longs invalidated by a shooting star
- 2007USD/CHF candlestick stars at leftover swing levels
- 2015First-hour opening range breakout rules