2005issue C011-2
Volume-confirmed longs invalidated by a shooting star
A 2004 S&P 500 session is restated here as a two-timeframe checklist, not a forecast. Longs stay eligible only while the daily 50-day moving average and a broken downward price channel remain intact, trigger from an intraday volume-price surge, and close on a five-minute shooting star when follow-through fails.
- Keep new longs eligible only while the daily index remains above its 50-day moving average and the broken downward price channel still counts as a change in swing structure.
- Read a volume surge that arrives with rising bars as confirmation that a long hypothesis is active, rather than treating volume in isolation.
- A five-minute shooting-star bar can mark same-session invalidation when an upward volume-price sequence loses follow-through.
- A volume spike on a bar that is already rising can be watched instead of entered, even if the daily gate is still intact.
A two-timeframe checklist
This article is an editorial case study of one 2004 S&P 500 session. It writes a two-timeframe checklist as a hypothesis that can be falsified, not as a forecast.
In that reading, longs stay eligible only while a daily moving-average gate and a broken downward price channel remain intact. The trigger is an intraday volume-price surge. A star candle is treated as same-session invalidation when follow-through fails.
The daily gate
After the 2004 U.S. presidential election, the daily S&P 500 was described as having crossed above its 50-day moving average and broken above a downward-sloping price channel that had acted as resistance. After that channel break, the next resistance area identified on the daily chart was the February and March 2004 highs. With the index above its 50-day moving average, the case allowed new long entries only when volume was strong.
Editorial reading: the 50-day average is a higher-timeframe directional gate that permits long setups only while price remains above it. The downward-sloping daily resistance band is a price channel whose break is read as a change in swing structure. Those conditions keep a long hypothesis eligible. They do not forecast that the February and March 2004 highs will be reached.
S&P 500 daily, Sep 2003–Nov 2004
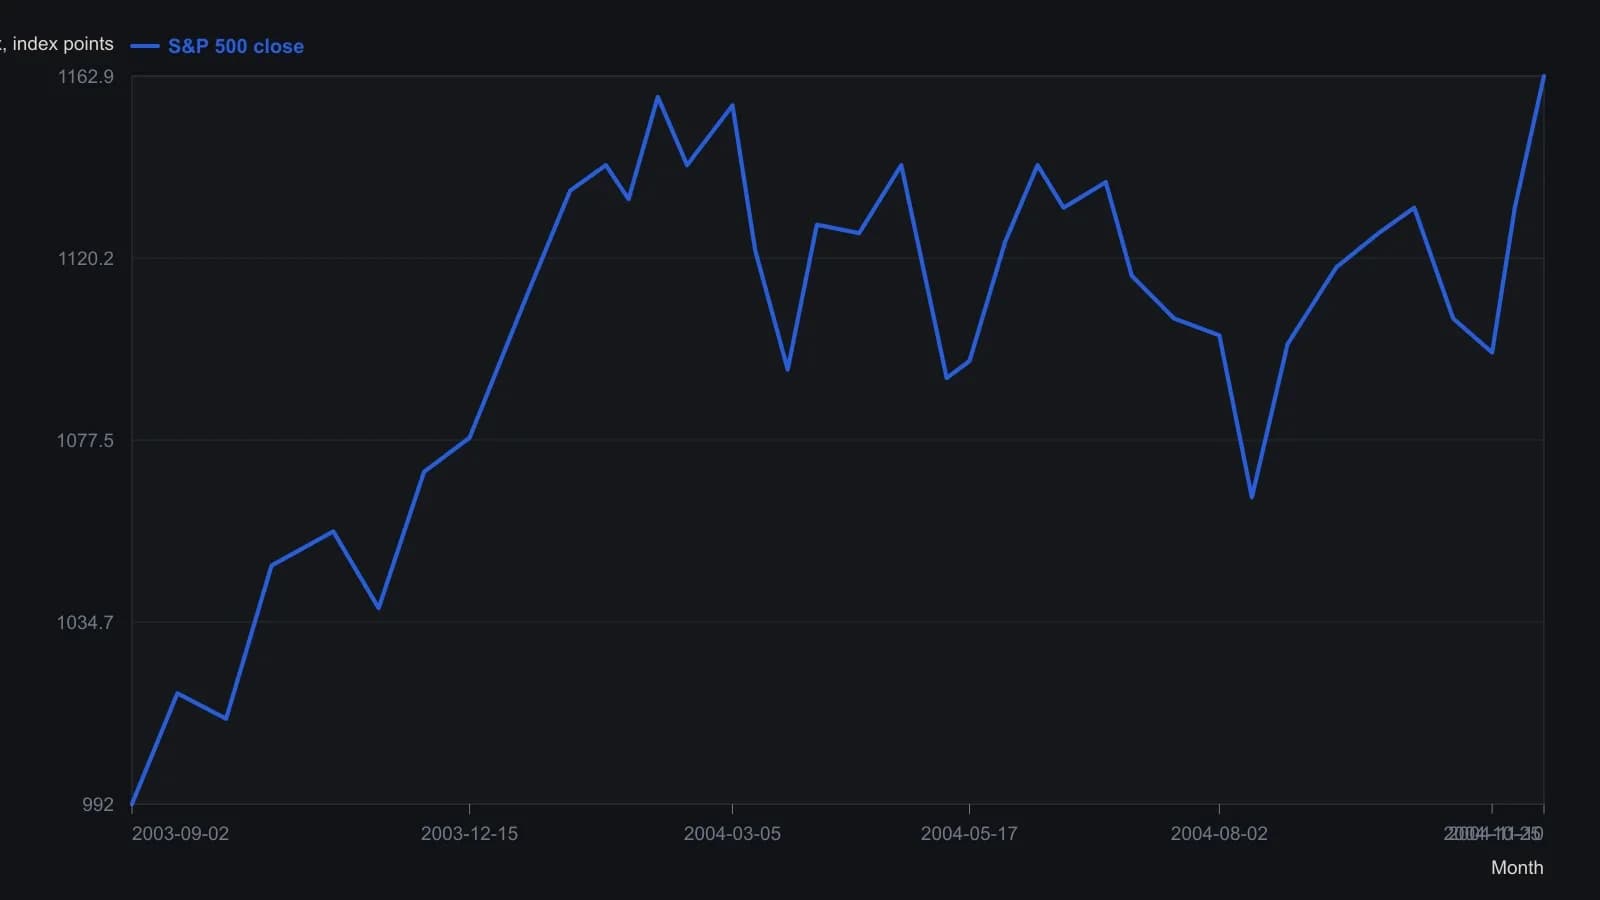
Closes estimated from the raster of Figure 1; y-axis ticks are 20 index points, so readings are rounded to the nearest 2–3 points. Last print 1162.91 is the on-chart quote, not a visual estimate.
Intraday volume-price confirmation
On a five-minute e-mini chart, a volume increase near 10:45 a.m. Pacific time as prices began to rise led to a long fill at 1166.00 and an exit at 1168.00.
A later five-minute sequence that again combined a volume spike with a long rising bar was watched rather than entered immediately because the move was already underway. After a pullback and a high-momentum bounce, a long filled at 1169 at 11:45 a.m. while the daily index remained above its 50-day moving average.
Editorial reading: volume-price analysis means reading a volume surge that arrives with rising bars as confirmation that a long hypothesis is active, rather than treating volume in isolation. The later spike was watched because that rising move was already underway.
A shooting star as same-session invalidation
The 11:45 a.m. long was then closed at 1168 when price turned against the position. A shooting-star candlestick on the five-minute chart was identified as the visible signal of that downward turn.
Editorial reading: a shooting-star bar is an invalidation signal that an upward volume-price sequence has lost follow-through. Same-session invalidation means closing the intraday long once price turns against the fill, instead of waiting for the daily filter to fail. In this session the daily index was still above its 50-day moving average when the five-minute long was closed.
How the hypothesis can fail
Editorial reading: the checklist stays open only if three conditions hold at once. The daily index remains above the 50-day moving average after the price-channel break. An intraday volume surge arrives with rising bars before the long is taken. Follow-through continues after the fill.
The hypothesis is false for that session if the daily gate is already gone, if volume is treated as a reason to buy without rising bars, or if a shooting-star turn is ignored until the daily average is lost. The archive session shows the third test being applied on the five-minute chart.
All readings on this track · 6 readings
- 2002Constructing engulfing and star patterns from OHLC bars
- 2002A wave worksheet of Fibonacci clusters and reversal stars
- 2004Morning star reversal graded with a stochastic oversold check
- 2005Volume-confirmed longs invalidated by a shooting star
- 2007USD/CHF candlestick stars at leftover swing levels
- 2015First-hour opening range breakout rules