2001issue C121-7
Construct a volume-weighted continuous-lead contract
When the most actively traded futures month expires, formulas that need prior bars cannot be compared across a hard switch. A continuous-lead-contract blends the outgoing and incoming months only inside a short prorated-rollover-window so later indicators inherit one nearby series.
- Formulas that need prior bars cannot be compared across a hard switch to the next futures month, because moving averages, accumulated support or resistance, and price-divergence checks become discontinuous.
- A continuous-lead-contract prorates the outgoing and incoming months only inside the short window when volume and open interest actually migrate, started by a manual prorate-flag rather than a rewrite of the whole history.
- Constructed open, high, low, and close use volume-share-weights, and lead-volume and lead-open-interest are prorated with analogous own-share weights so later indicators see one continuous input.
- Open interest in the outgoing month begins falling quickly about a month from expiry, while incoming open interest rises and incoming volume eventually overtakes. That pattern is the practical cue to start blending.
A hard switch breaks later formulas
When the most actively traded futures month expires, formulas that need prior bars cannot be compared across a hard switch to the next month. Moving averages, accumulated support or resistance, and price-divergence checks all inherit a break because their inputs become discontinuous.
Rollover-management is the work of switching analysis from an expiring lead month to the next while controlling that discontinuity. The historical workflow does not ask the chart to jump. It builds a continuous-lead-contract: a constructed nearby-futures series that blends the outgoing and incoming expiries during the roll so price, volume, and open interest remain usable by formulas that accumulate history.
Blend only while activity migrates
A continuous lead series can be built by prorating the outgoing and incoming months volume and open interest, but only across the short window when activity actually migrates rather than by rewriting the entire history.
That prorated-rollover-window was described as about 14 to 20 trading days for S&P 500 futures, about 10 days for Treasury bonds, and about 14 to 20 days for sugar 11. The exact start was treated as subjective and marked by a manual prorate-flag. The flag is the switch that starts replacing raw lead price, volume, and open interest with the blended values once roll activity is judged to have begun.
Volume-share weights price the bar
Volume-price-analysis here uses the lead month share of two-month volume to weight open, high, low, and close so the constructed bar reflects where contracts actually traded. Volume is treated as the variable that records how many contracts transacted.
Constructed open, high, low, and close are volume-share averages of the two months. Each price equals the old-month print times V1/(V1+V2) plus the new-month print times V2/(V1+V2). Those fractions are the volume-share-weights applied when building the fictitious lead values.
S&P 500 continuous-lead close through the June 2001 roll
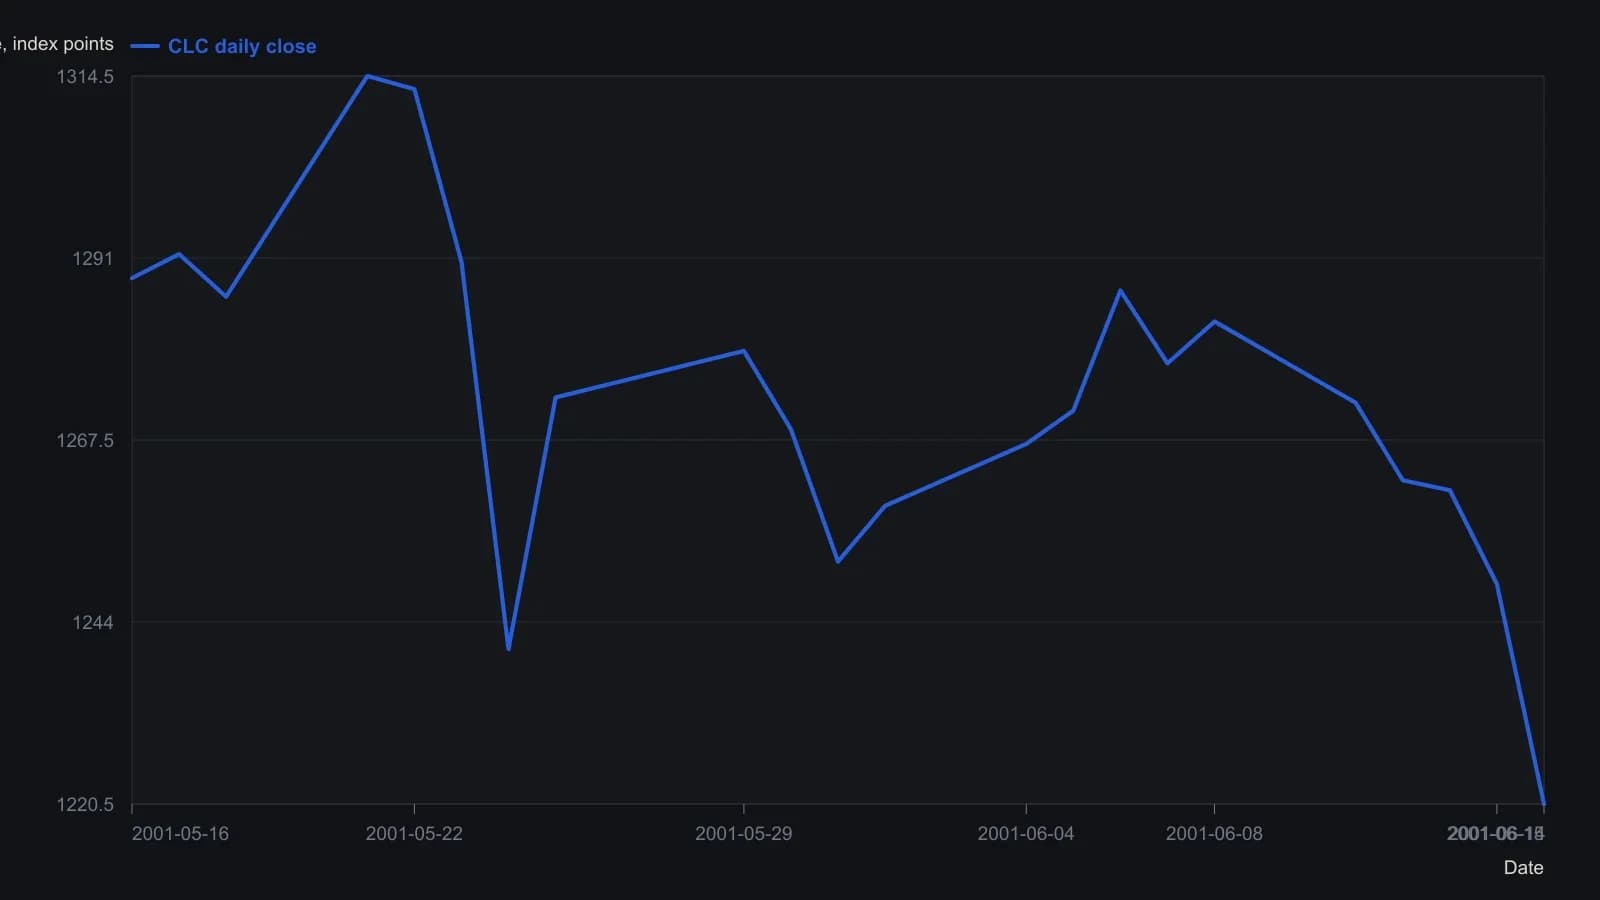
Suler blends the outgoing June and incoming September months only inside a short roll window of about 14–20 S&P sessions. Inputs are CME regular-hours prints; Globex is omitted. After the flag in column M is set, open, high, low and close are volume-share weighted.
Open interest shows who still holds the old expiry
Open-interest-analysis uses total open interest and the share still sitting in the current lead as weights or diagnostics for how far holdings have migrated to the next expiry.
When the outgoing month is about a month from expiry, its open interest begins falling quickly while incoming open interest rises and incoming volume eventually overtakes. That pattern is the practical cue to start blending.
Later indicators inherit one nearby series
Lead-volume and lead-open-interest are themselves prorated with analogous own-share weights so any later indicator that consumes those series sees one continuous input through the switch.
Lead-volume is contracts traded in the current or constructed nearby month, as distinct from the two-month total. Lead-open-interest is open interest remaining in the current or constructed nearby month, again as distinct from the two-month total. Once the prorate-flag is on, those constructed series replace the raw lead inputs.
The same splice on other markets
The same prorated-lead construction was also applied to Treasury bond, sugar 11, and major currency futures, not only to the S&P 500 example.
During the December 2000 and March 2001 prorated windows, total volume and open-interest curves took unusual shapes attributed to index-arbitrage programs and book-squaring ahead of expiry.
A translator for a shared pane
A y-axis-translator is a linear remap that places one series onto another series plotting range so price, volume, open interest, and oscillators can be compared on one pane without sharing units.
A linear map ABn = (An + C) * X, with C = (AB2*A1 - AB1*A2)/(AB1 - AB2) and X = AB1/(A1+C), overlays price on a volume and open-interest pane. Zero anchors are replaced by range midpoints so a 0-100 oscillator can still be placed on a chosen price band.
On the illustrated S&P 500 continuous-lead series ending with the June 2001 expiry, the calculated rollover patches tracked contemporaneous cash-index levels shown on a proxy scaled to one-tenth of the cash index.
All readings on this track · 8 readings
- 1989Treasury auction-rollover as yield-to-price series construction
- 1991Calendar spread execution for futures month rolls
- 1992Converting OHLC, session, and rollover series for analysis
- 1992Linked futures series for mechanical system evaluation
- 1998Percentage back-adjusted futures series
- 2001Construct a volume-weighted continuous-lead contract
- 2013Construct a continuous futures series from the roll you can execute
- 2018Commodity-basket exposure as a contract-design problem