1993issue C061-4
A volatility-direction filter for dual moving-average crossovers
Keep a dual moving-average crossover as the timing clock, then gate it with a relative volatility index built from a lookback standard deviation of closes rather than daily net price change. Run the same gate on the relative strength index to see when a second reading is only restating the first.
- A moving-average crossover remains the timing clock. The second oscillator is a confirming filter that accepts, delays, or exits that clock rather than originating the trade.
- The relative volatility index applies the relative-strength calculation to a 10-day standard deviation of closing prices, so it reports directional volatility rather than daily net price change.
- Crossover buys are taken only when that index is above 50, and crossover sells only when it is below 50, with delayed entries and exits at 60 and 40.
- The same confirmation, delayed-entry, and exit rules were also applied to the relative strength index so a price-change filter could be compared with the volatility-direction filter.
Keep the timing clock separate from the confirming filter
The pairing is motivated by the observation that many confirming indicators reuse price-change information already present in the timing model, so a second reading should be based on a different measurement of market strength.
In this archive workflow, the timing signal is a moving-average crossover: a 10-bar simple moving average crossing a 20-bar simple moving average. The confirming filter is the relative volatility index. That second reading accepts, delays, or exits the crossover. It does not originate the trade by itself.
Directional volatility is not daily net price change
The relative volatility index applies the relative strength index calculation after substituting a 10-day standard deviation of closing prices for daily net price change. It is scaled from zero to 100, with readings above 50 treated as upside-directed volatility and readings below 50 as downside-directed volatility.
That midline summary is directional volatility: whether recent close-to-close variability has been concentrated on the upside or the downside.
Confirmation, delayed entry, and exit
Under the test rules, a moving-average crossover buy is taken only when the relative volatility index is above 50, and a crossover sell is taken only when it is below 50.
If a crossover buy is ignored because the relative volatility index is below 50, a long entry is still allowed if that index later rises to 60 or above. If a crossover sell is ignored because the index is above 50, a short entry is still allowed if it later falls to 40 or below.
A long position is exited if the relative volatility index falls to 40 or below, and a short position is exited if it rises to 60 or above.
The same gate on the relative strength index
The same confirmation, delayed-entry, and exit rules were also applied to the relative strength index so a price-change filter could be compared with the volatility-direction filter. In this pairing the relative strength index is a same-rules control filter, not a new timing model.
The historical sample covers six markets, each observed for 650 hourly bars.
Editorial interpretation: agreement between the two gates suggests the second reading may only be restating price-change information already present in the moving-average clock. Disagreement suggests the standard-deviation substitution has produced a different measurement of market strength. The archive records the shared rule set. It does not rank the two oscillators.
10/20 SMA crossover profit with RSI versus RVI confirmation
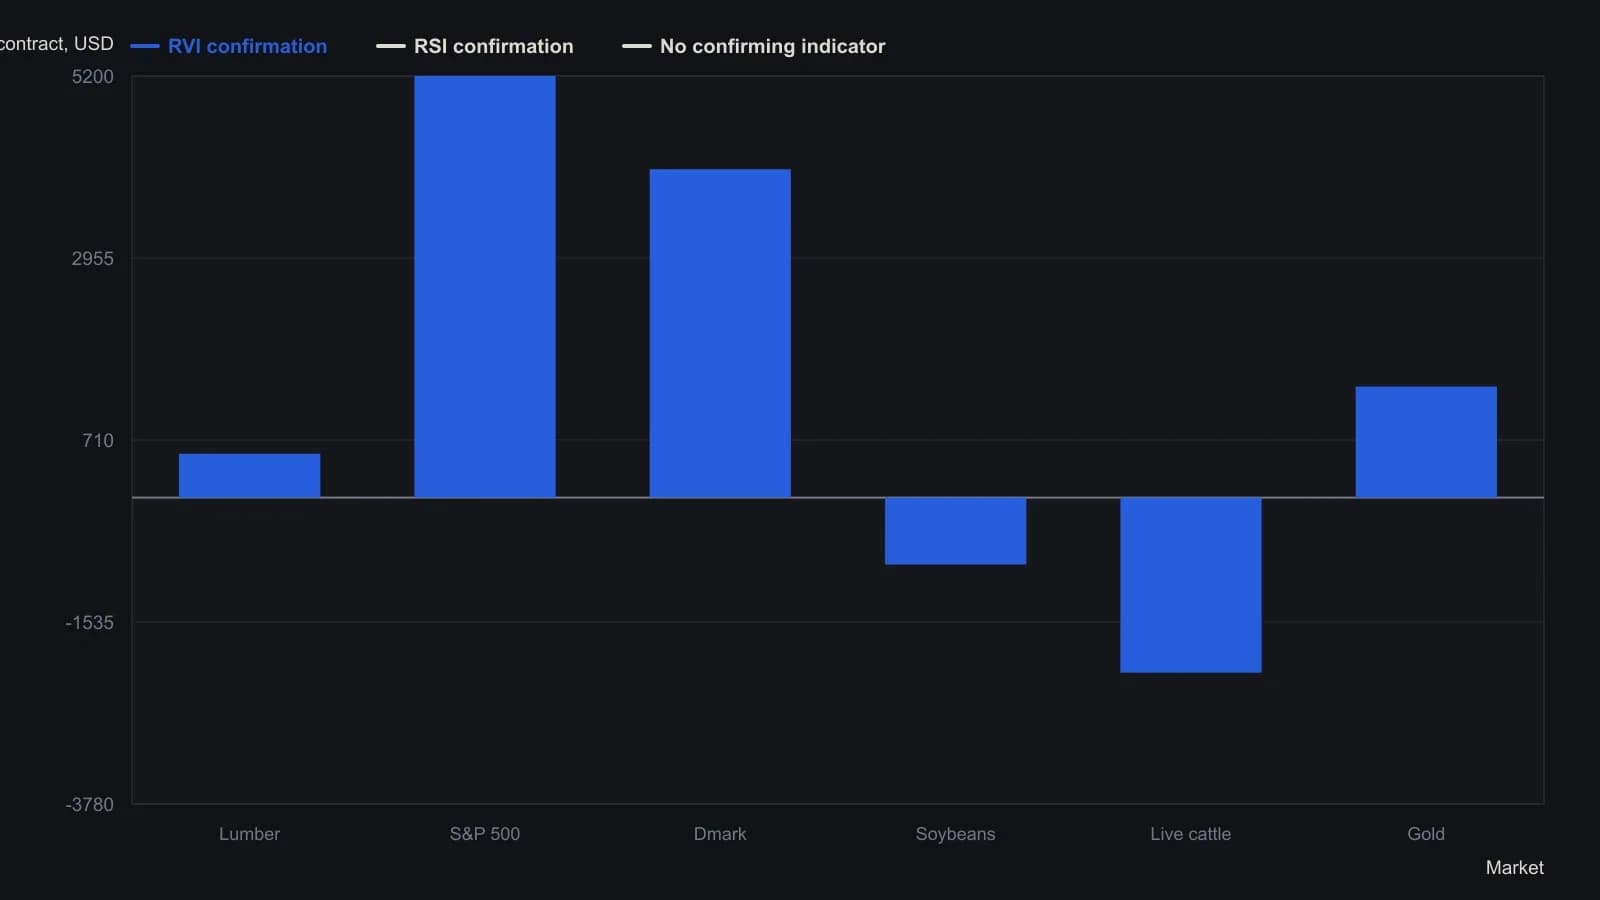
Each market covers 650 hourly bars. Buys are taken only when the oscillator is above 50 and sells only when it is below 50, with delayed entries at 60/40 and exits at the opposite 40/60 band. No commission adjustment.
All readings on this track · 7 readings
- 1990Constructing a two-line relative volatility index
- 1993A volatility-direction filter for dual moving-average crossovers
- 1995Constructing the relative volatility index and inertia
- 1995Constructing a high-low relative volatility trend filter
- 2005Genetic optimization of relative-volatility crossover rules
- 2017How lookbacks, sign, and bands construct a volatility oscillator
- 2017Building a signed relative-volatility oscillator