1995issue C091-4
Constructing the relative volatility index and inertia
The relative volatility index keeps a two-stream ratio but feeds each stream a lookback standard deviation routed by the sign of the bar. High-based and low-based paths are then averaged, and inertia is added as a simple moving-average layer.
- The relative volatility index keeps the two-stream ratio of a relative-strength oscillator but substitutes a lookback standard deviation of recent closes for one-day net change.
- A directional volatility split writes that standard deviation to the up stream on an up bar and to the down stream on a down bar, with the unused stream set to zero.
- High-based and low-based versions of the same split, smooth, and ratio steps are averaged to form the new relative volatility index.
- Inertia is a simple moving average of the new relative volatility index, used here as a second construction layer rather than as a separate signal rule.
What the oscillator is built to measure
The relative volatility index keeps the two-stream ratio of a relative-strength oscillator but substitutes a 10-day standard deviation of recent closes for one-day net change.
The stated construction goal is to measure the general direction of volatility rather than the direction of price change itself.
The directional volatility split
A directional volatility split writes the current lookback standard deviation to the up stream on an up bar and to the down stream on a down bar, with the unused stream set to zero.
On an up bar the 10-period standard deviation of the chosen series is written to the up-volatility stream and the down stream is set to zero. On a down bar the assignment is reversed.
The recursive volatility smoother
A recursive volatility smoother first averages the opening block of split-volatility values, then updates as thirteen parts prior value plus one part new observation, divided by fourteen.
Each split-volatility stream is initialized with a 10-value average and then recursively updated as thirteen times the prior smooth plus the new observation, divided by fourteen.
The oscillator value is 100 times the smoothed up-volatility divided by the sum of the smoothed up-volatility and smoothed down-volatility.
High-based and low-based paths
High-based and low-based versions repeat the same split, smooth, and ratio steps with daily highs or daily lows in place of closes.
The new relative volatility index is the midpoint of a high-based relative volatility index and a low-based relative volatility index built with the same lookback and smoother. That midpoint is the average of the two oscillators.
Inertia as a second construction layer
Inertia is defined as a 20-period simple moving average of the new relative volatility index.
Editorial. That moving-average step is a second construction layer on the oscillator, not a separate signal rule.
S&P 500 old RVI, new RVI and inertia
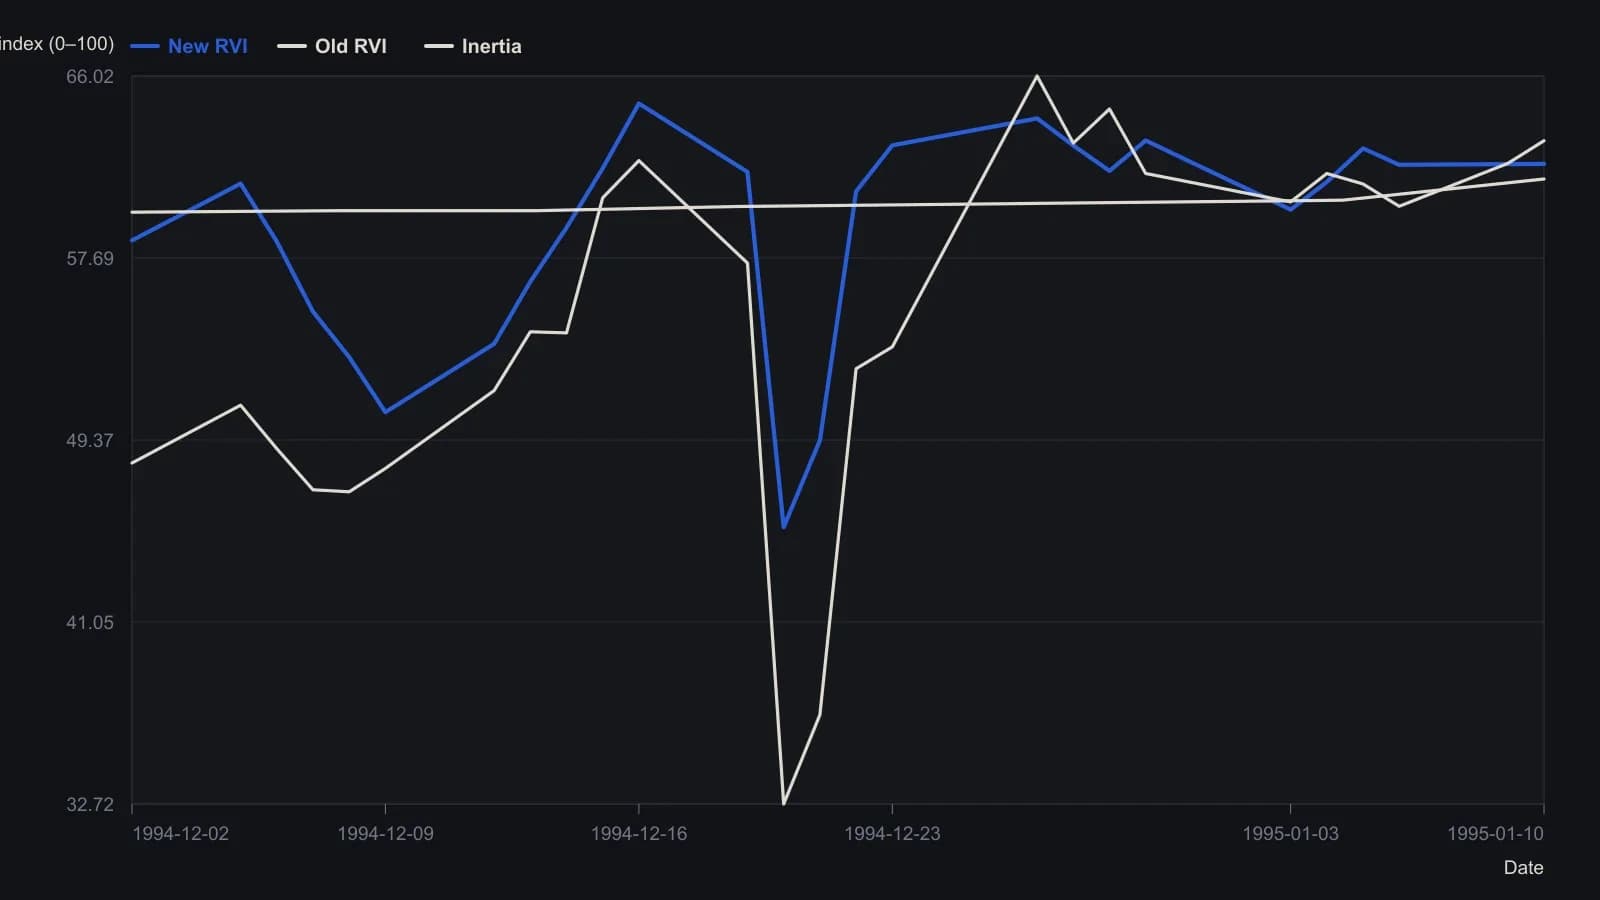
Old RVI routes a 10-day close STDEVP by the sign of the close, then Wilder-smooths (seed average of the first 10 routed values, then ((13*prev)+today)/14) and scales 100*up/(up+down). New RVI is the average of the same oscillator on highs and on lows. Inertia is the 20-period simple average of new RVI, first shown once that window is full.
All readings on this track · 7 readings
- 1990Constructing a two-line relative volatility index
- 1993A volatility-direction filter for dual moving-average crossovers
- 1995Constructing the relative volatility index and inertia
- 1995Constructing a high-low relative volatility trend filter
- 2005Genetic optimization of relative-volatility crossover rules
- 2017How lookbacks, sign, and bands construct a volatility oscillator
- 2017Building a signed relative-volatility oscillator