1995issue C091-6
Constructing a high-low relative volatility trend filter
The relative volatility index keeps the relative strength index split, smooth, and 0-to-100 envelope, and feeds each side a 10-period standard deviation instead of one-period net change. Averaging a high-based reading with a low-based reading produces a refined oscillator. A 20-period overlay of that oscillator around 50 is the longer-horizon trend filter.
- The relative volatility index measures the direction of volatility so it can confirm indicators that are derived from price change.
- It reuses the relative strength index structure of splitting observations, smoothing each side, and scaling a 0-to-100 ratio, and substitutes a 10-period standard deviation for one-period net change.
- A refined reading averages a high-based index with a low-based index, so the construction is not limited to closing prices.
- A 20-period average of that refined index is the trend filter: a rising regime above 50 and a falling regime below 50, with an optional linear-regression variant held at 50 until enough bars have accumulated.
The envelope as a construction workbench
The relative volatility index is built to measure the direction of volatility so it can serve as a confirming filter beside indicators that are derived from price change. A longer-horizon trend filter is presented as a way to measure trend strength over a different sampling span and to reduce how often a system acts.
Editorial interpretation: TradersWeek treats the familiar 0-to-100 oscillator envelope as a construction workbench. Swap net price change for a lookback dispersion input, then average a high-based series with a low-based series, so a 50-line multi-week smoother can be taught as a confirming trend filter rather than another entry trigger.
Trend as inertia
Trend is framed as inertia that needs a chosen direction rule and a mass proxy. The direction rule is illustrated by whether price sits above or below a 200-day average. Volatility is offered as that mass proxy rather than participant counts.
Split, smooth, and scale with a dispersion input
The relative volatility index reuses the relative strength index structure of splitting observations, smoothing each side, and scaling the ratio from 0 to 100, but substitutes a 10-period standard deviation of the chosen price series for the usual one-period net change.
On each bar the 10-period closing standard deviation is placed in the up bucket if the close rose and in the down bucket if the close fell. Those buckets are recursively smoothed over 14 periods and combined as 100 times the up average divided by the sum of the two averages.
High-based and low-based series
The refined index is the average of a high-based relative volatility index and a low-based relative volatility index so the construction is not limited to closing prices. The parallel calculations substitute the high series or the low series for the close, then the two results are averaged.
A slower overlay around 50
The long-term trend filter is a 20-period average of that refined index, read as a rising regime above 50 and a falling regime below 50. That slower reading is the inertia overlay.
An alternative construction replaces the 20-period simple average with a 20-period linear-regression value of the refined index and holds the filter at 50 until enough bars have accumulated.
Swiss franc daily with 20-period inertia around 50
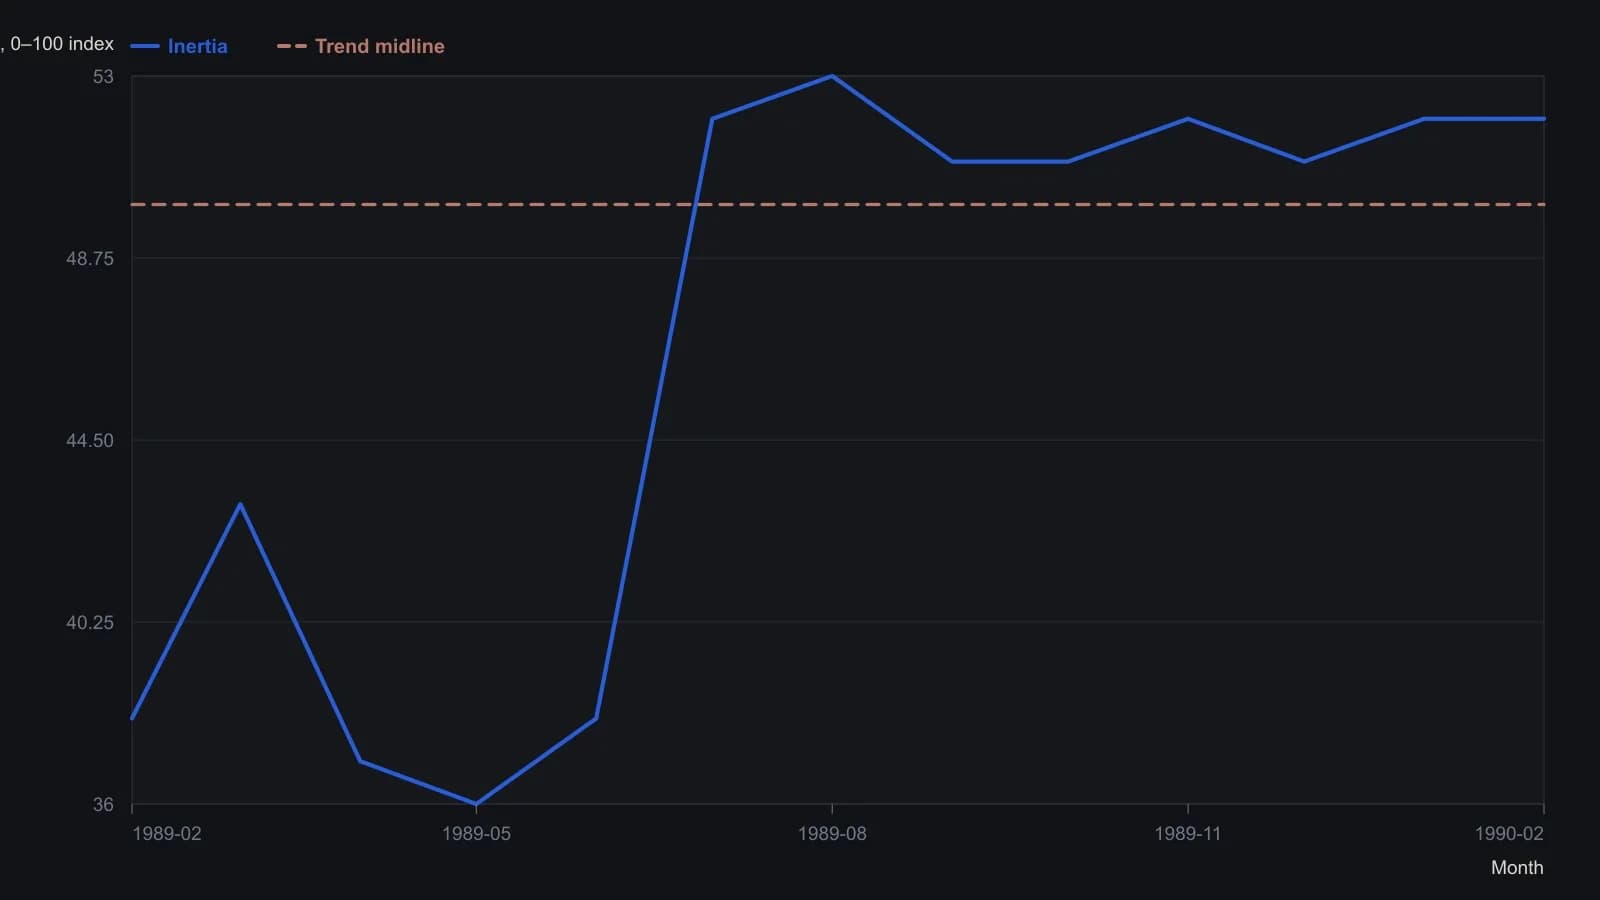
Inertia is the 20-period average of (RVIH+RVIL)/2. The source prints a 50 midline and last reading 51.58; plotted points are approximate reads from the raster and are spaced monthly so the curve is not over-specified.
All readings on this track · 7 readings
- 1990Constructing a two-line relative volatility index
- 1993A volatility-direction filter for dual moving-average crossovers
- 1995Constructing the relative volatility index and inertia
- 1995Constructing a high-low relative volatility trend filter
- 2005Genetic optimization of relative-volatility crossover rules
- 2017How lookbacks, sign, and bands construct a volatility oscillator
- 2017Building a signed relative-volatility oscillator