2001issue C151-3
Evaluate portfolio survival with value-at-risk, budgets, and scenarios
Retail practice often ranks return first and treats risk as a subjective impression, while institutional process treats risk measurement as a required input. In editorial terms, drawdown control is an evaluation checklist: score everyday loss with a value-at-risk forecast, bound each name inside a portfolio risk budget, and keep size only if the same holdings still stand after documented crash scenarios.
- Treat risk measurement as a required input, not a subjective impression that follows return.
- Score everyday loss with a value-at-risk forecast, then bound each name inside a portfolio risk budget.
- Keep size only after scenario risk analysis revalues the same book under named historic shocks and extreme-market loss.
- Judge the result as risk-adjusted return, including whether it sits above or below the level implied by measured risk.
An evaluation checklist
Retail practice often ranks return first and treats risk as a subjective impression, while institutional process treats risk measurement as a required input.
In editorial terms, drawdown control is a checklist a trader can fail a book on. Score everyday loss first with a value-at-risk forecast. Bound each name next inside a portfolio risk budget. Keep size only if the same holdings still stand after documented crash scenarios.
Identification, measurement, and management
Risk study can be sequenced as identification, measurement, and management, spanning equity, interest-rate, currency, and commodity exposures.
The same scoring frame can be applied to a single holding or an entire book across equities, funds or trusts, bonds, equity options, and foreign currencies.
Rank, risk impact, and extreme-market loss
A position can be evaluated by its rank versus other securities, its contribution to portfolio risk, and an expected-loss figure under extreme market conditions. In this reading, that contribution is risk impact, and the extreme-market figure is extreme-market loss.
A portfolio readout can classify exposure as aggressive or passive, show the diversification effect, and compare volatility with a broad equity index.
Score everyday loss with value-at-risk
Value-at-risk is a quantitative loss forecast built from ordered price or related observations over a stated lookback and sampling interval, used as an explicit baseline rather than a gut feel.
In editorial terms, this forecast is the first pass or fail on the book. It scores ordinary loss before any name is given more size.
RiskGrade ranking of the sample holdings
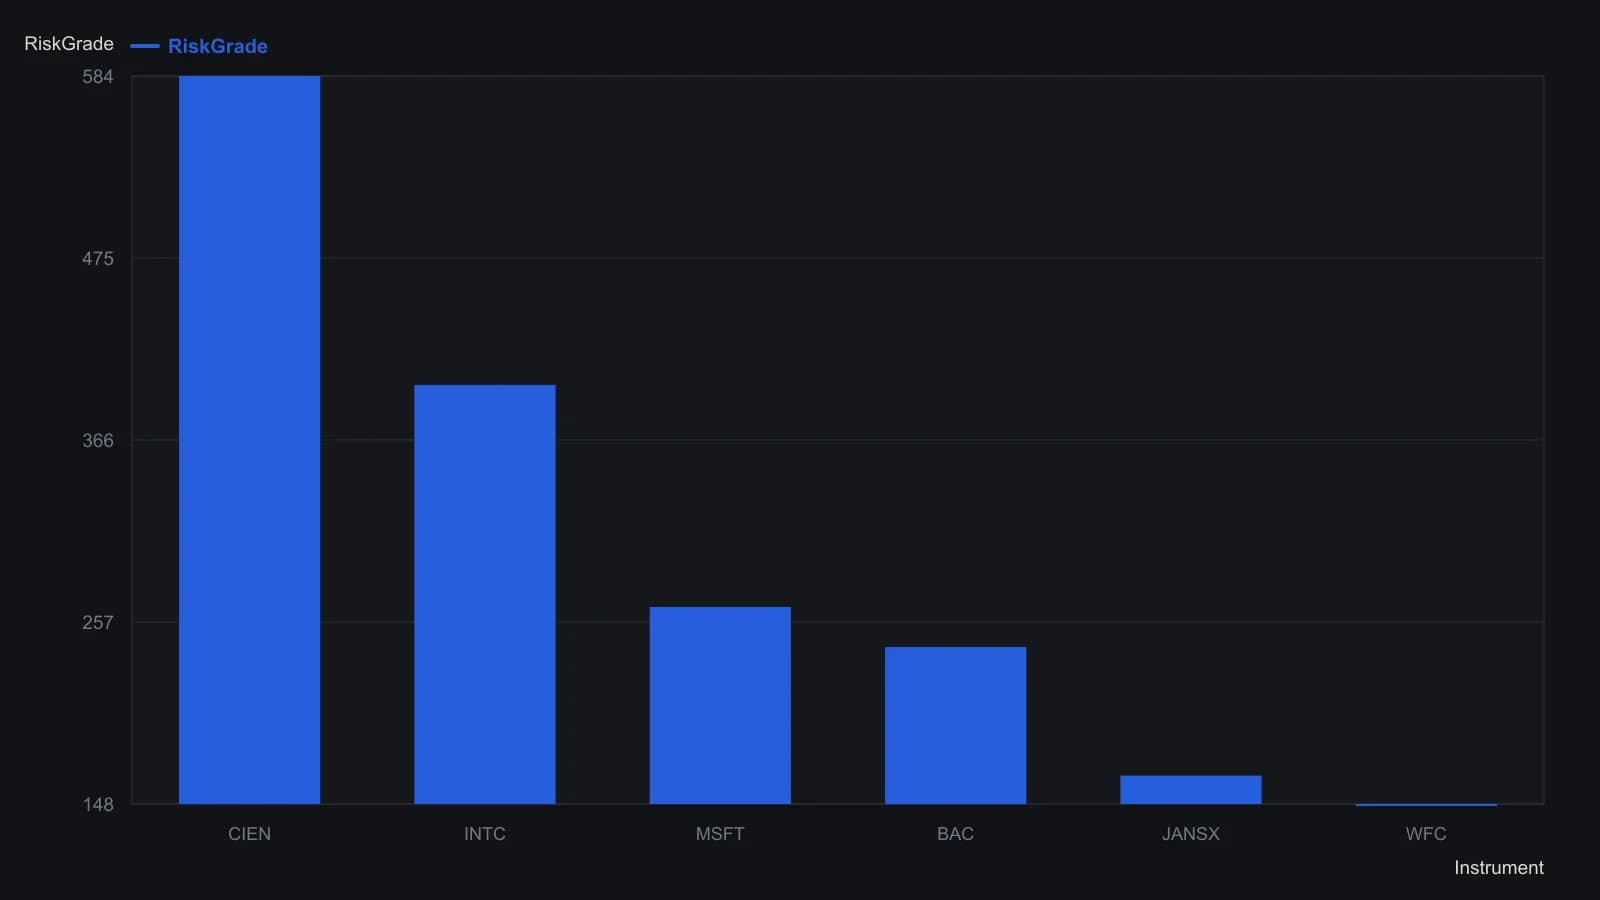
The on-page bar panel drew only the five highest scores; Wells Fargo (WFC, 148) is included from the same holdings table.
Bound each name with a portfolio risk budget
A portfolio risk budget is a pre-trade and in-trade bound on loss or exposure, expressed through position contribution, diversification effect, and user-set risk thresholds.
Risk can be bounded as a budget by setting user-defined upper and lower thresholds and issuing an alert if those bounds are breached or if risk diverges sharply from a chosen benchmark.
A what-if workflow lets the user add or remove holdings and then compare the revised book with the original on the same risk charts.
Keep size after scenario risk analysis
Ordinary value-at-risk forecasts are criticized for omitting extraordinary events, so a separate historical-event pass is used to re-examine the book.
Scenario risk analysis is a filter that revalues the current book under named historical shocks or extreme-market loss estimates before size is increased.
Built-in historic shocks, including the 1987 equity crash and a euro-area crisis, can be applied to estimate how the current portfolio would have changed.
In editorial terms, the book fails this checklist if those shocks leave the holdings unable to stand inside the same risk budget, even when the everyday value-at-risk forecast still looks ordinary.
Judge the result as risk-adjusted return
Returns can be judged relative to the risk taken, including whether results sit above or below the level implied by the measured risk. That reading is risk-adjusted return rather than raw price change.
All readings on this track · 6 readings
- 1990Score drawdown depth and duration as a pain budget
- 1993Comfort before capital: walk the tape before you size
- 1994Set the portfolio risk budget before you size
- 2001Evaluate portfolio survival with value-at-risk, budgets, and scenarios
- 2002Set mixed-book share counts from one portfolio loss bound
- 2010Treat the pairs book as one risk budget before adding a layer