2010issue C0246-51
How to judge a Kalman filter forecast as a Trend filter
A Kalman filter forecast is treated as a Trend filter: a fixed-size trade is taken only when the alpha indicator exceeds a threshold, and skill is scored with an idealized fortune path. The archive warns that a threshold chosen from the entire sample on day 1 cannot be implemented as shown.
- A Kalman filter forecast is scored as a Trend filter by taking a fixed-size trade only when the alpha indicator exceeds a threshold C, and the daily result is the signed relative price change.
- Last-day fortune is an idealized accumulation with no commissions and fills at the prescribed prices. It scores direction skill rather than a live account.
- Filter efficiency compares that fortune path with available profit, the sum of absolute daily returns, which is the perfect-direction benchmark in this evaluation.
- A C and T fitted on the entire sample on day 1 cannot be treated as a live trading rule. The authors leave a shorter recent window for later work.
The filter as a directional rule
The evaluation treats a Kalman filter forecast as a directional Trend filter. A fixed-size trade is taken only when the alpha indicator exceeds a threshold C. When the indicator does not exceed that threshold, the trade is skipped. The daily result is the signed relative price change.
Last-day fortune is defined as an idealized accumulation that assumes no commissions and fills at the prescribed prices. That path is used to score the filter's direction skill. It is not presented as a live-account result.
The Ford illustration
On the Ford illustration the authors report a C of 0.38. They mark a largest daily result of 0.436 when the filter called the move from 1.72 toward 2.47, even though the predicted level 1.84 missed the actual close. Last-day fortune is 1.37 on 124 trades, and the profit ratio is 0.59.
Efficiency against available profit
Filter efficiency is the ratio of accumulated fortune to available profit. Available profit is the sum of absolute daily returns. For the Ford example that ratio is 0.104 against an available-profit total of 13.15.
Choosing the threshold
An optimal C is chosen by minimizing the distance between the fortune path and the available-profit path. When that criterion and last-day-fortune maximization disagree, the larger C is preferred, because the larger C yields a smoother fortune line.
Ford fortune versus available profit
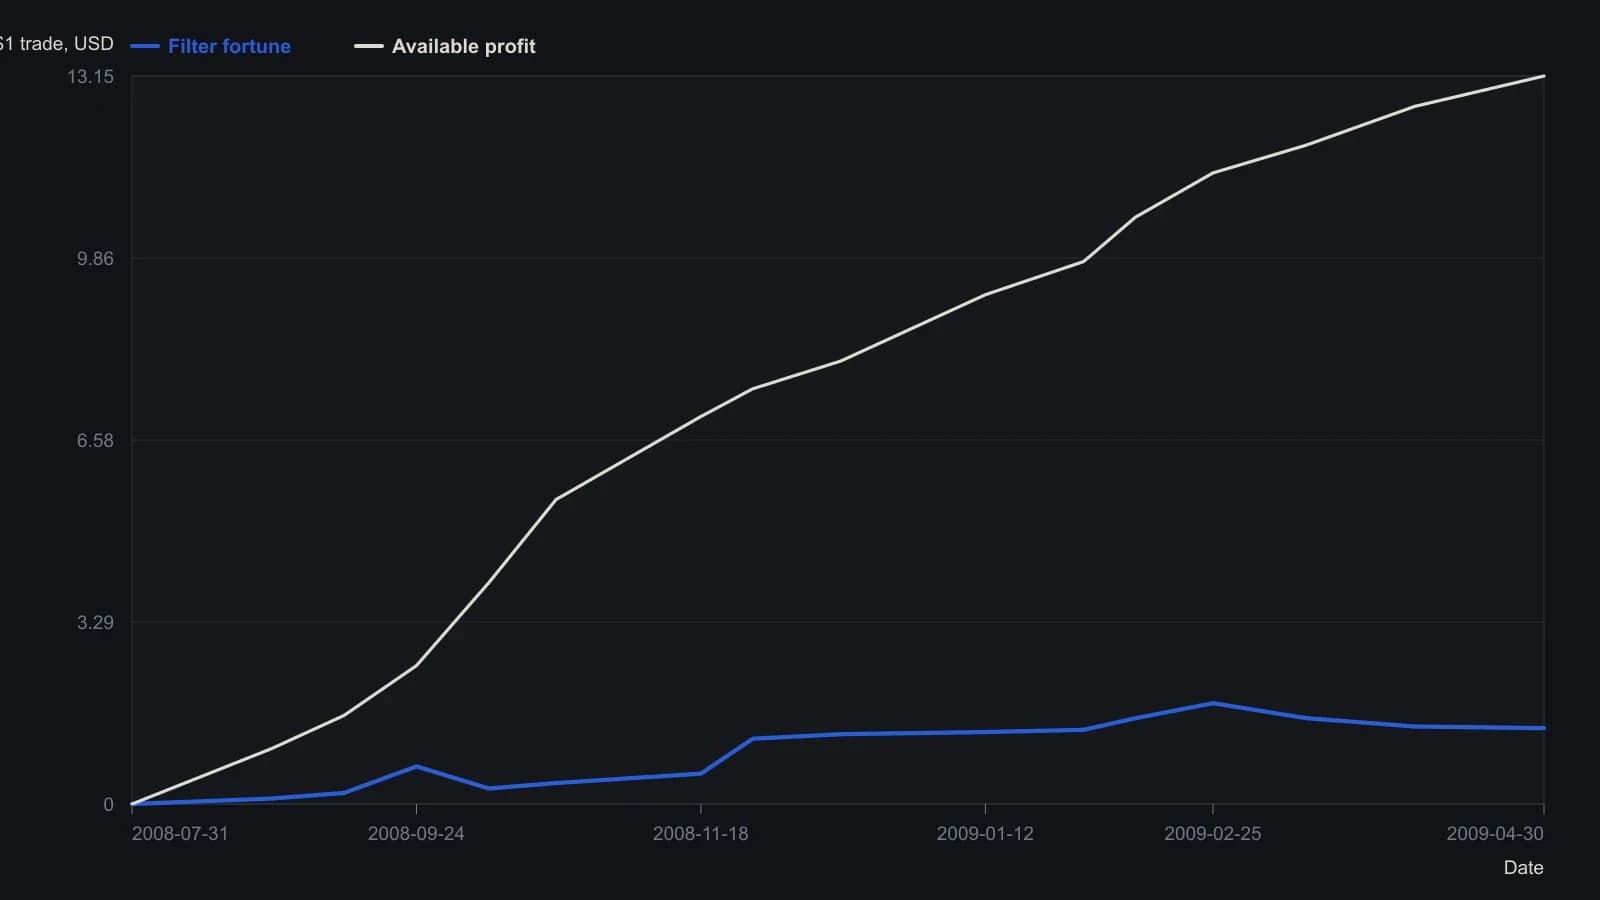
Idealized path with a $1 stake, no commissions and no slippage. Threshold C = 0.38 and tracking T = 1.86 were chosen on the entire Ford sample, so this path is not a live trading rule.
What the table does not prove
Across the tabulated symbols, reported efficiencies, profit ratios, trade counts, and dollar returns vary widely by name and by the fitted T and C. The profit ratio is described as nearly independent of the dataset.
The authors state that selecting only the top table rows would look highly profitable. They also state that the simulation cannot be implemented as shown, because optimal C and T are determined from the entire sample on day 1.
They propose that fitting T and C on a shorter recent window, such as the prior quarter or two, would be the operational way to obtain values for the next day's forecast. They leave that rolling evaluation to later work.
All readings on this track · 7 readings
- 1985Constructing a recursive two-gain price smoother
- 1989Constructing alpha-beta price channels and trend filters
- 1989Alpha-beta lag parameters versus moving-average windows
- 1995Constructing a reproducible alpha-beta price channel
- 2006Shared coefficient construction for recursive price filters
- 2010How to judge a Kalman filter forecast as a Trend filter
- 2019Constructing a calendar-conditioned trend filter