2020issue C0130-33
Evaluating countertrend ETF rules against a buy-and-hold control
Five London-listed equity ETFs are converted to a common euro series and compared with four countertrend filters that share one mechanical long-short procedure. The archive uses a buy-and-hold control as the baseline for that shared procedure.
- The study converts five London-listed equity ETFs into a common euro price series and omits dividends and transaction costs from the evaluation.
- The buy-and-hold control starts from a 10,000-euro equal-weight allocation of 2,000 euro per symbol, resizes monthly, and is labeled BENCH.
- All four indicators share one mechanical trading system: a buy state while flat or short goes or reverses long at the next open, and a sell state while flat or long goes or reverses short at the next open.
- The authors report that only these four screened indicators beat the buy-and-hold control in their test window and that the four rules produced smaller combined drawdowns than that control.
What the archive evaluates
The study converts five London-listed equity ETFs into a common euro price series and omits dividends and transaction costs from the evaluation. Four indicators are then run through one mechanical trading system, a fixed procedure that maps indicator states into next-bar long, short, or reverse actions and a position size.
The buy-and-hold control
The buy-and-hold control is a passive equal-weight allocation used as the comparison baseline. It starts from a 10,000-euro equal-weight allocation of 2,000 euro per symbol, resizes monthly, and is labeled BENCH in the comparison app.
On the combined five-ETF control, the source records a maximum drawdown of 2,826 euro and a reward-to-risk ratio of 1.62. That ratio is the quotient of profit-and-loss over maximum drawdown for a completed test window. The source also records a notable equity decline from April 2015 through February 2016.
Buy-and-hold equity of the five-ETF control basket
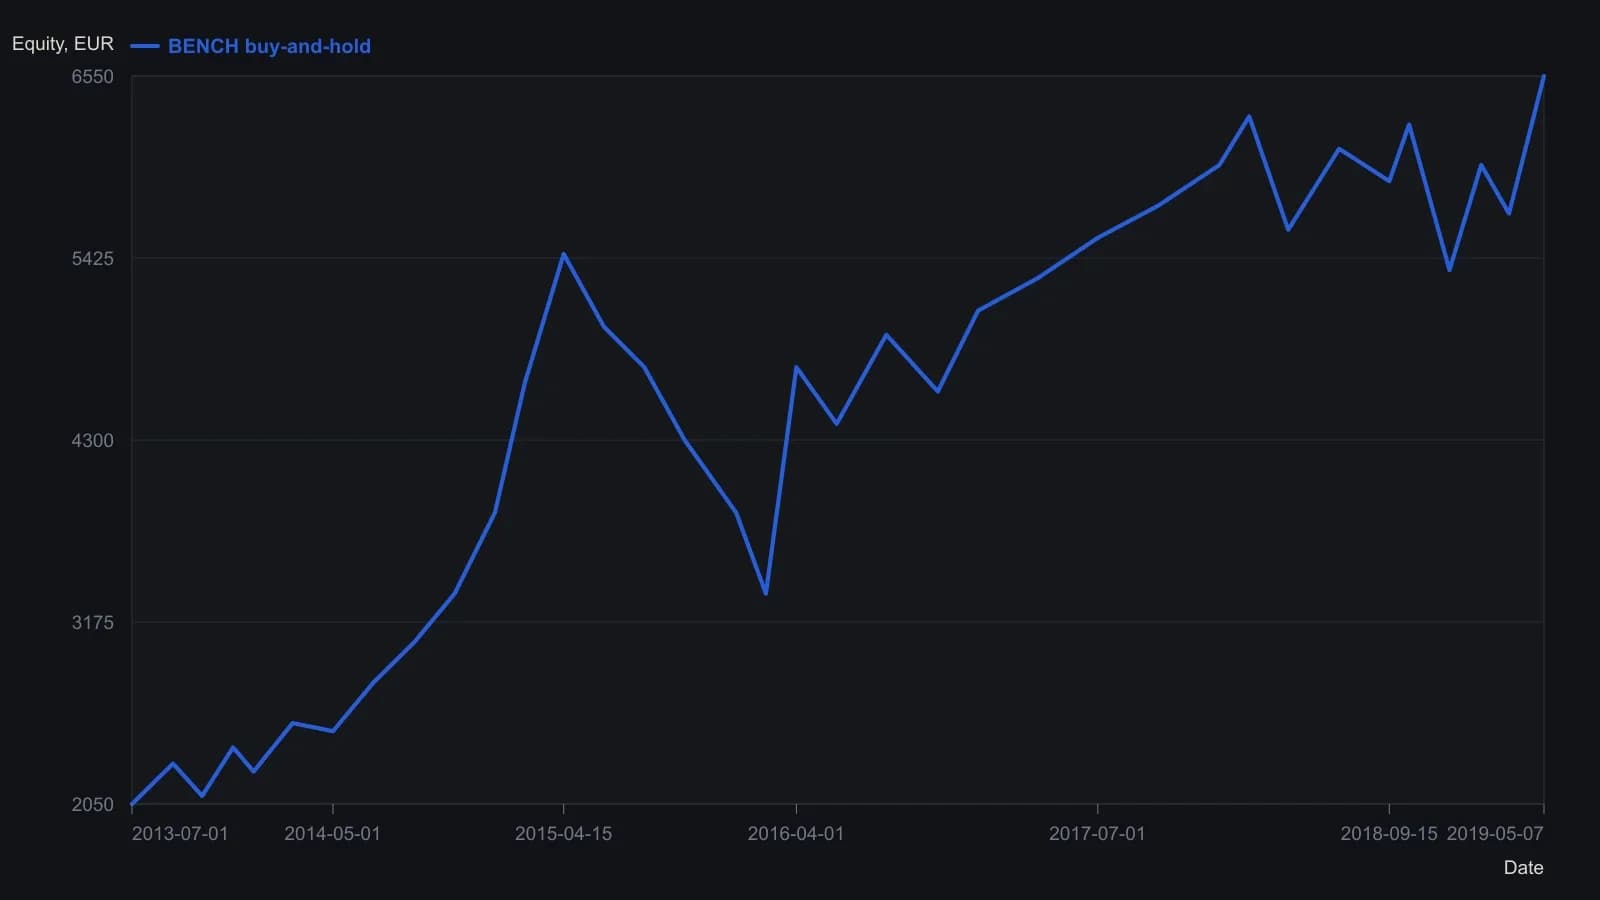
The study converts five London-listed ETFs to euro prices, omits dividends and transaction costs, and resizes a 2,000 euro sleeve per fund each month. The screenshot runs from 1 July 2013 to 7 May 2019 with the UI parameter left at 9. Raster readings are rounded to 50 euros and cannot resolve every daily extreme behind the tabulated drawdown.
The shared long-short mapping
Mean reversion, as used here, is a countertrend rule family that fades recent price direction instead of following it. All four tested indicators follow the same mapping. If a buy state appears while flat or short, the system goes or reverses long at the next open. If a sell state appears while flat or long, it goes or reverses short at the next open. Next-bar execution means entering or reversing at the following open after a signal on the current bar.
Four countertrend filters
The four indicators are constructed as countertrend filters. ALMA2 fades a 10-bar Arnaud Legoux average. HMATR fades a 10-bar Hull average plus twice the 10-bar average true range. The hull moving average is a smoothed price baseline used here with a range overlay to emit directional states. TEMA2 fades a 10-versus-20 triple-exponential crossover. TREND fades an average-true-range and bar-difference composite.
Each countertrend state is confirmed when the same directional condition holds on four of the past five bars.
The comparison surface
The interactive evaluation surface reports profit and loss, maximum drawdown, their quotient, trade count, equity path, and a trade list for each symbol, plus a bundled five-ETF view. The authors report that, among the indicators they screened, only these four beat the buy-and-hold control in their test window, and that the four rules produced smaller combined drawdowns than that control.
All readings on this track · 6 readings
- 2010Constructing a Hull smoother and a Hull-based oscillator gate
- 2015Evaluating moving-average lag in cycle filters
- 2017Rebuild a Hull moving average with linear-regression intercepts
- 2017A Hull moving-average forecast in a credit-spread trend procedure
- 2019Constructing nested regression projections as smoothers
- 2020Evaluating countertrend ETF rules against a buy-and-hold control