2003issue C051-4
Constructing the fractal dimension index
A fractal dimension index is built from rescaled-range analysis and an estimated Hurst exponent, then placed on a one-to-two scale that treats 1.5 as fully random and any other reading as sequential memory in the price path.
- The fractal-dimension reading is constructed from rescaled-range analysis and an estimated Hurst exponent applied to all available time-price observations on the chart.
- Logarithmic returns are the preferred input because they add to cumulative returns; substituting raw prices is discouraged.
- On a scale from 1 to 2, a reading of 1.5 is treated as fully random, values nearer 1 as more linear or trending, and values nearer 2 as more volatile or space-filling.
- Editorial: distance from that random midpoint is a falsifiable gate for whether a chart is even eligible for a trend or mean-reversion hypothesis.
What the index measures
A fractal is described as a structure whose parts resemble the whole. It is measured by a non-integer dimension that records how the object occupies space. On a price chart, fractal dimension is a non-integer measure of how completely a price path occupies the space between a line and a plane.
Self-similarity is presented as the reason a fractal keeps its dimension when measurement scale changes, including across market time frames.
How the reading is built
The fractal-dimension reading is constructed from rescaled-range analysis and an estimated Hurst exponent applied to all available time-price observations on the chart.
Rescaled-range analysis standardizes the range of cumulative deviations by local dispersion and studies how that ratio grows with sample length. The Hurst exponent is the scaling exponent estimated from that growth. After the Hurst exponent is estimated, fractal dimension is obtained as two minus that exponent because the price chart is treated as two-dimensional.
Why logarithmic returns are the input
Logarithmic returns are specified as the preferred input because they add to cumulative returns. A logarithmic return is the natural log of successive prices, used so period increments add to a cumulative path. Substituting raw prices is discouraged.
Reading the one-to-two scale
A Hurst value of 0.5 is treated as the random-walk case in which cumulative range grows with the square root of time. Any other value is interpreted as sequential memory.
On a scale from 1 to 2, a reading of 1.5 is treated as fully random. Values nearer 1 are treated as more linear or trending. Values nearer 2 are treated as more volatile or space-filling.
A persistent series is characterized as smoother and less reversal-prone, a regime whose path is relatively smooth and reversal-light compared with a random walk. An antipersistent series is characterized as more jagged and reversal-prone, a regime whose path is relatively jagged and reversal-heavy compared with a random walk.
FDI screen of seven contracts, 7 March 2003
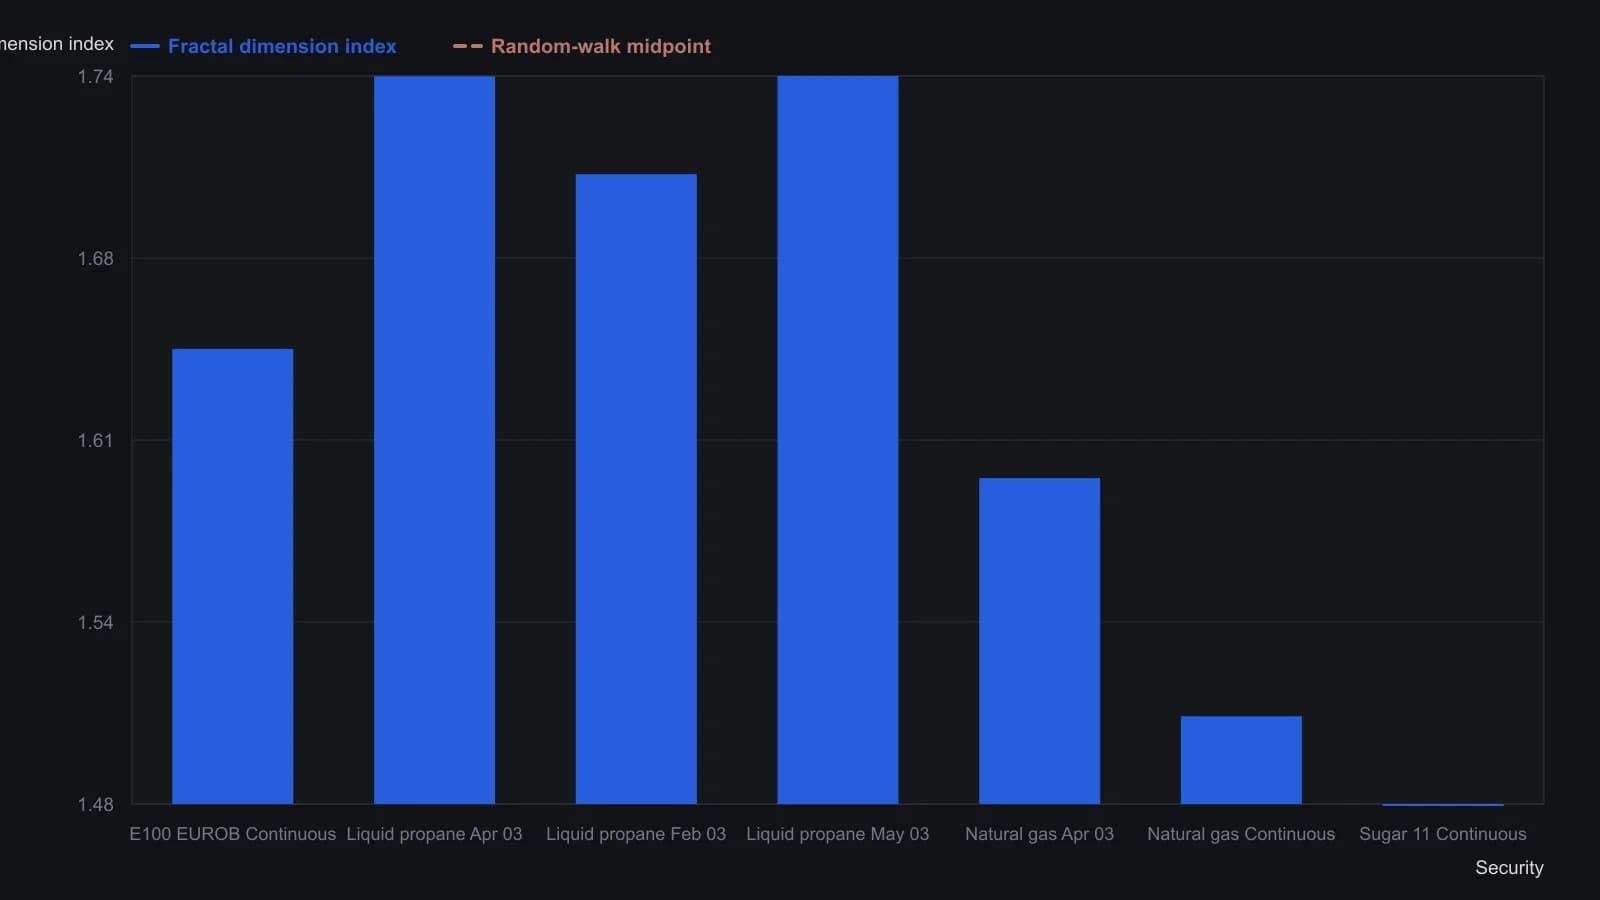
FDI is an estimated Hurst exponent converted as D = 2 − H on logarithmic returns; the source warns that too short a sample can distort the reading.
Sample length and bar noise
Too little history can distort the Hurst estimate. The adequate sample length is described as unsettled, and shorter bars are described as noisier inputs.
What a daily energy-futures illustration showed
In a daily energy-futures illustration, the index declined as price began to trend. Markets are said to crest in fractal dimension before a new trend.
All readings on this track · 7 readings
- 1992Constructing fractal templates from successive index changes
- 1994Constructing polarized fractal efficiency as a path filter
- 2002Long memory, regimes, and the limits of bell-curve models
- 2003Constructing the fractal dimension index
- 2005Constructing a fractal-dimension adaptive moving average
- 2007Constructing a fractal-dimension regime filter
- 2015Constructing fractal swings as support-resistance atoms