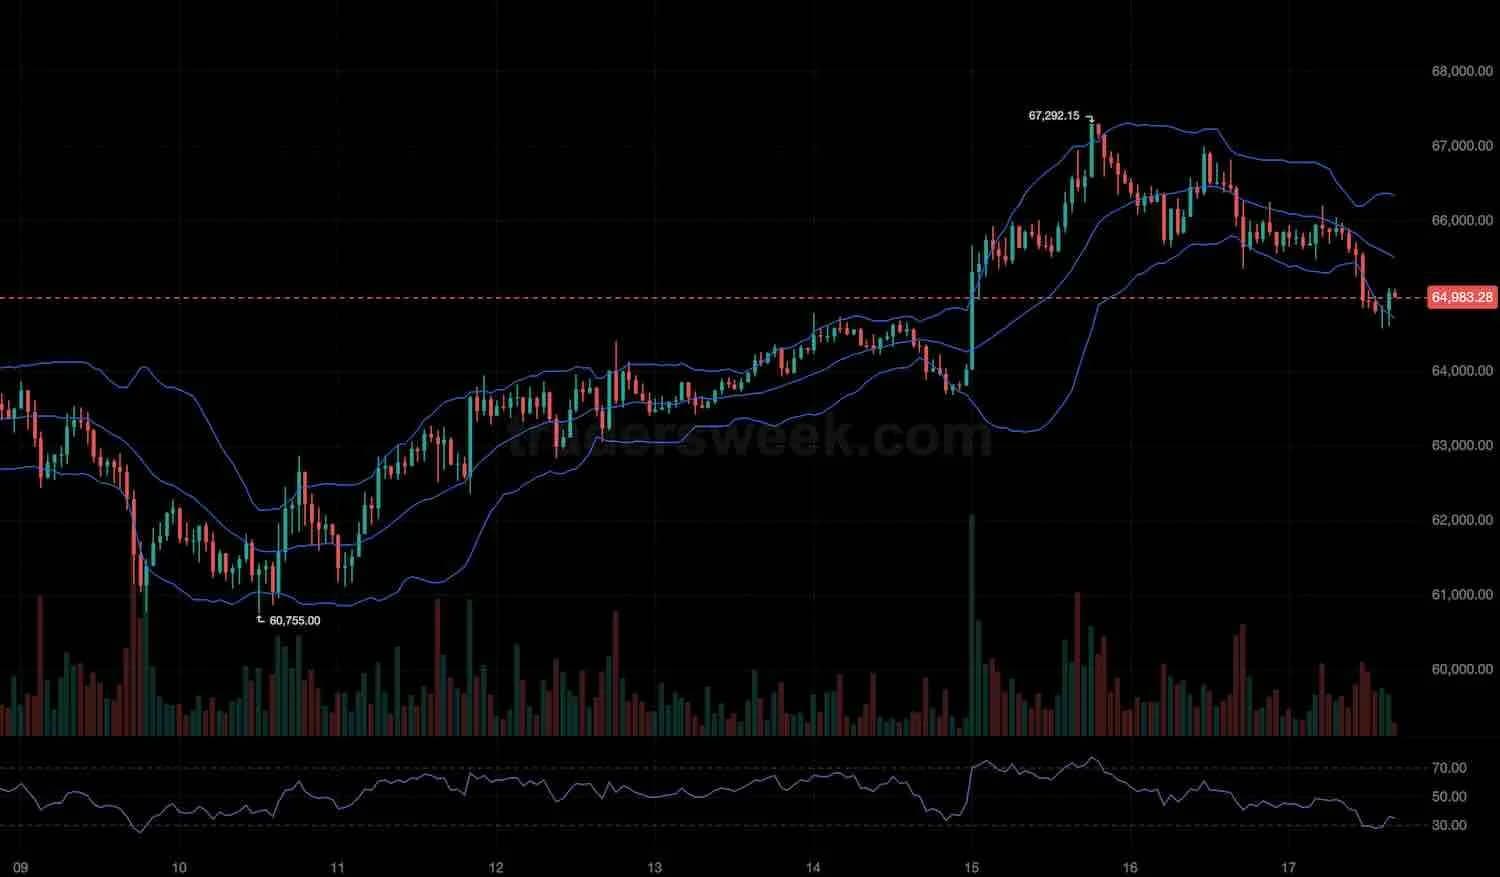
Bollinger Bands and RSI: smarter entries and exits
Bollinger Bands tell you how far price has stretched. RSI tells you whether the crowd is exhausted. The trade lives where both agree — and only when the trend gives permission.

Most traders stack indicators hoping that more lines mean more certainty. They usually get the opposite: two tools that disagree, and a reason to do something on every bar. Bollinger Bands and RSI are worth combining for the reverse reason. Used well, they agree far less often, and that scarcity is the edge.
Two tools, two different questions
Bollinger Bands answer a question about distance: given recent volatility, how far is far? When price rides the lower band it has stretched to the downside relative to its own normal range, and the upper band is that same statement inverted. RSI answers a question about exhaustion: is the crowd still pushing this move with conviction, or running out of it? One is about location, the other about momentum. A signal worth taking is one where both line up.
The four setups
The base long: price presses the lower band while RSI turns back up through 30 — stretched to the downside, but momentum is reclaiming. The base short is the mirror: price tags the upper band while RSI rolls back under 70. The stronger versions add a flush. If RSI first drives deep into oversold and only then turns up, the move that follows tends to be cleaner, because the sellers spent themselves before the reversal. The same holds near the highs: a more extended overbought reading that finally rolls over often precedes a sharper correction.
Let the trend filter veto you
Confluence between two oscillating tools is still incomplete without context. A 50-period moving average is the simplest fix. If it slopes up, take the longs and ignore the short signals; if it slopes down, do the reverse. A counter-trend signal against a clearly sloped average is the one most likely to be the trap. And when the average is flat, the honest read is that there is no trend to lean on, and the cleanest action is none.
The edge isn't in the indicators. It's in how rarely they're allowed to agree.
Manage it like a professional
A confluence entry earns nothing without a plan for being wrong. Define the stop first, beyond the band that just rejected price, where the premise is simply broken. Take the mean as the first objective: the middle band, the moving average, the place the rubber band snaps back to. Keep reward asymmetric to risk, move the stop to breakeven once the trade has paid for itself, and respect round numbers, because price clusters at them and so do other people's stops.