Lee la cinta. No los titulares.
Gráficos footprint, perfil de volumen, mapa de calor, análisis de clústeres y detector de grandes operaciones. Directo desde aggTrades del exchange, no instantáneas retrasadas. Ve lo que las instituciones hacen antes de que cierre la vela.
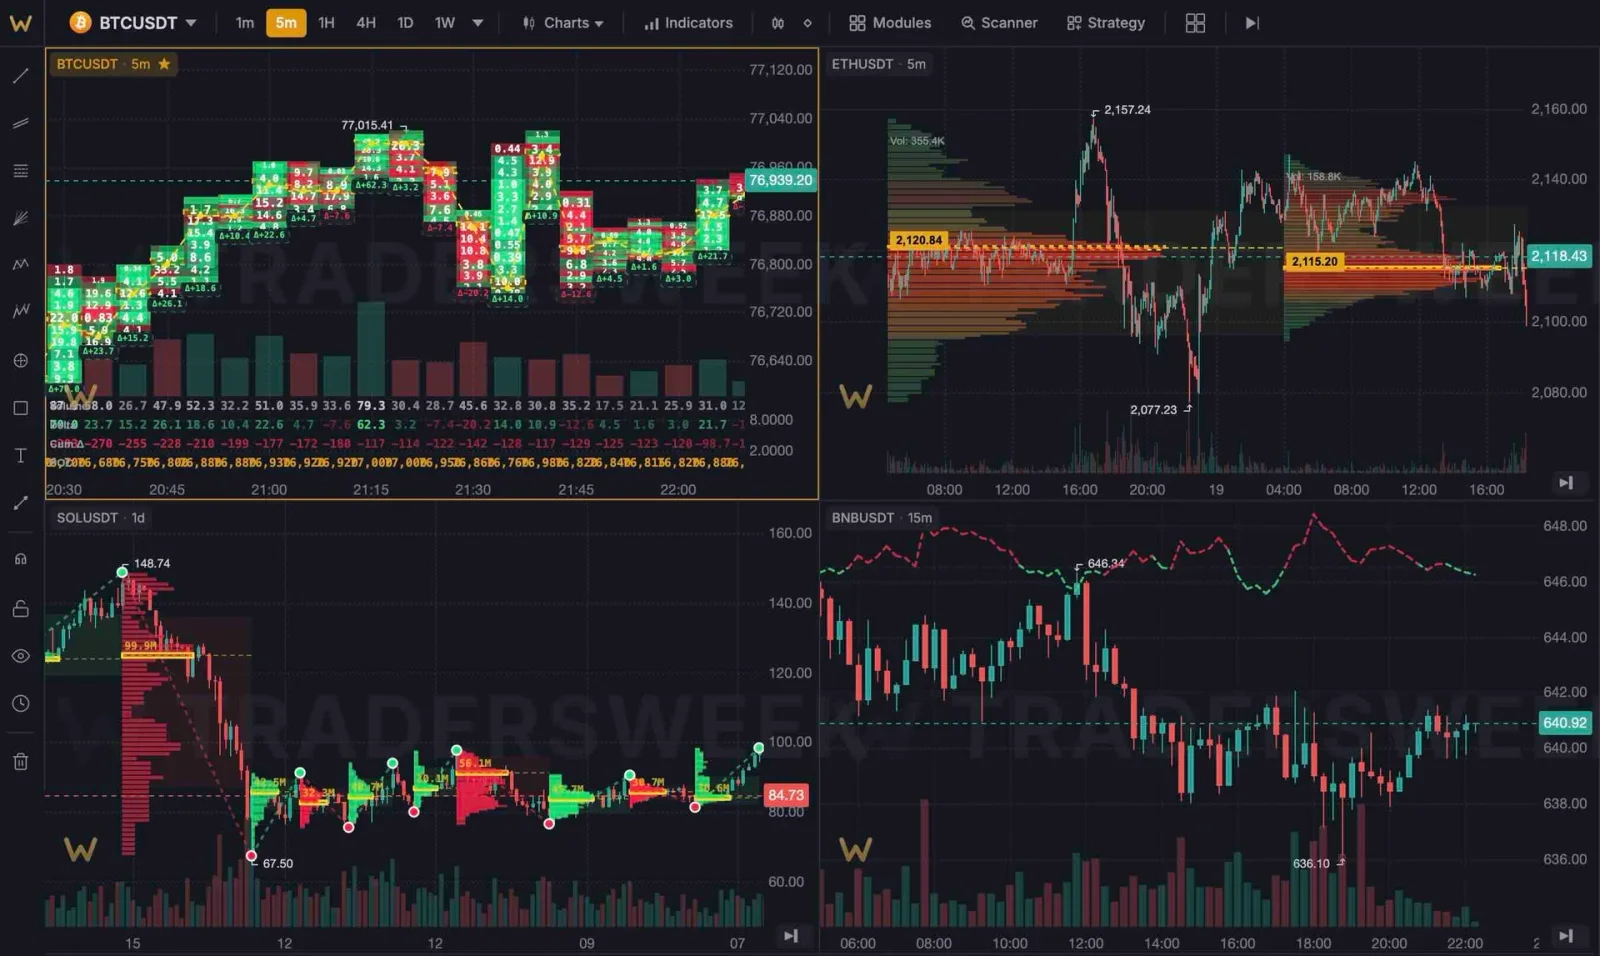
Cinco herramientas en un módulo
Cada herramienta revela una capa diferente del libro de órdenes. Úsalas juntas para leer la cinta por completo.
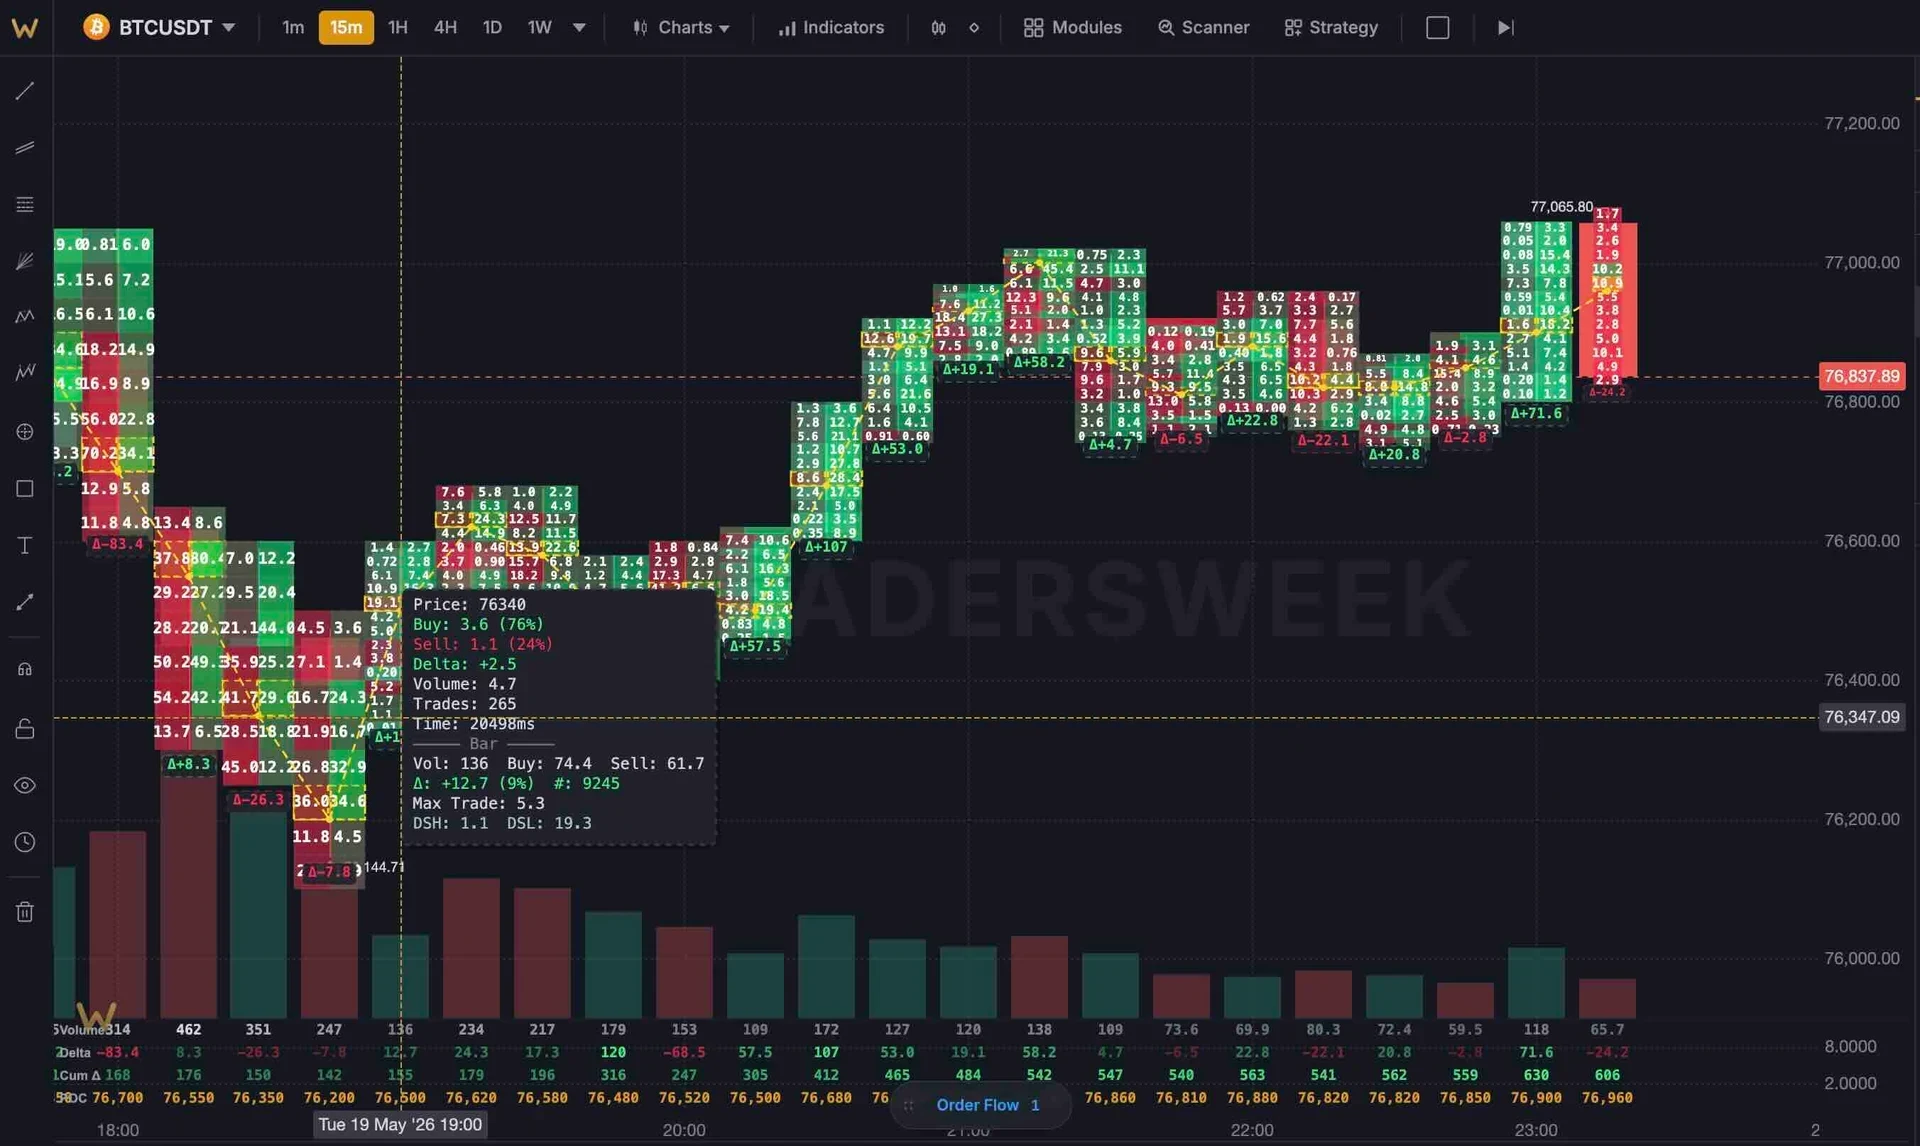
Gráfico footprint
Volumen de compra vs venta en cada nivel de precio, dentro de cada vela. Los desequilibrios se iluminan antes de que el precio se mueva. Incluye delta, ratio de agresividad y marcadores de subasta completada.
- Volumen compra/venta por nivel de precio
- Ratio de desequilibrio con umbral
- Detección de subasta completada
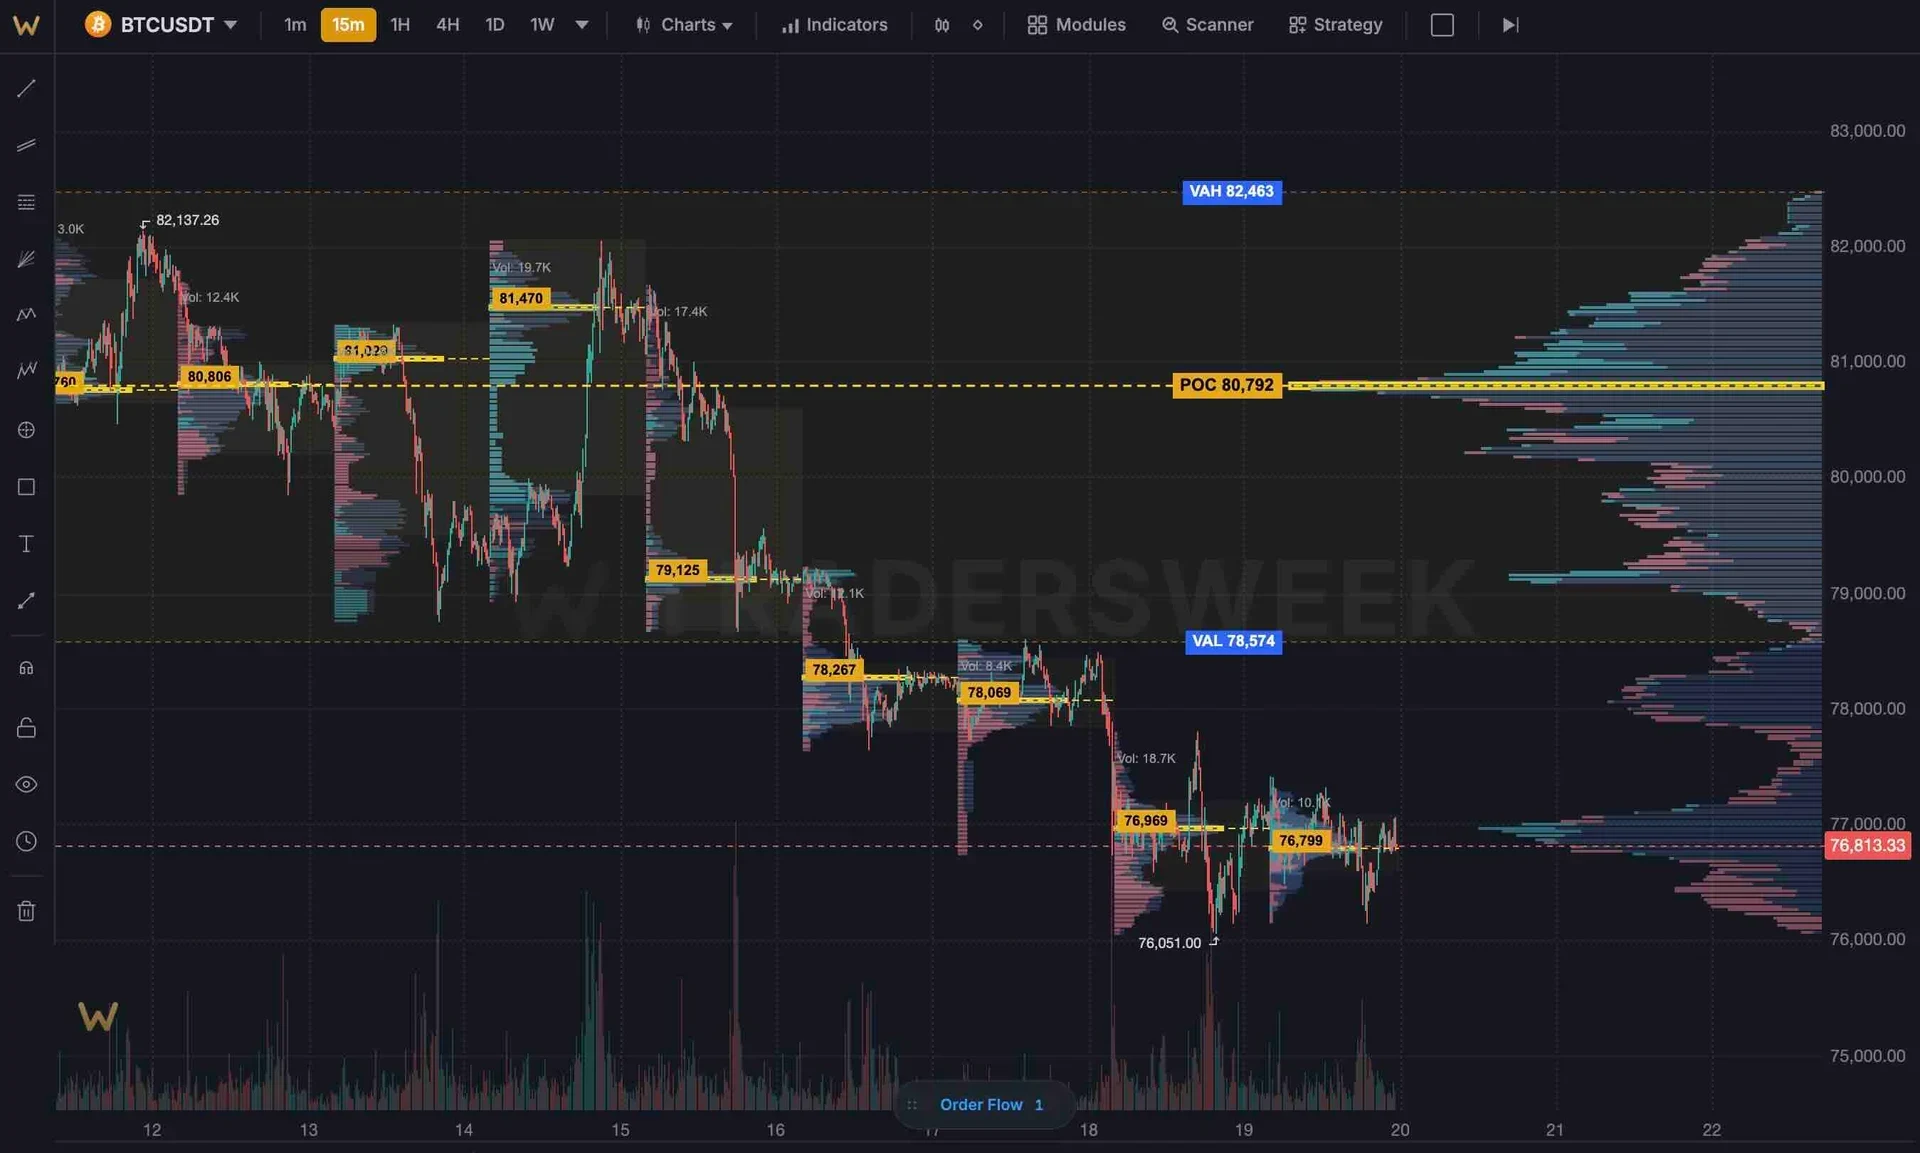
Perfil de volumen anclado
Arrastra un ancla a cualquier vela y ve la distribución del volumen. POC, VAH, VAL se actualizan en vivo. Sesión, compuesto o rango personalizado.
- POC, VAH, VAL en vivo
- Modos de sesión y compuesto
- Arrastrar ancla desde cualquier barra
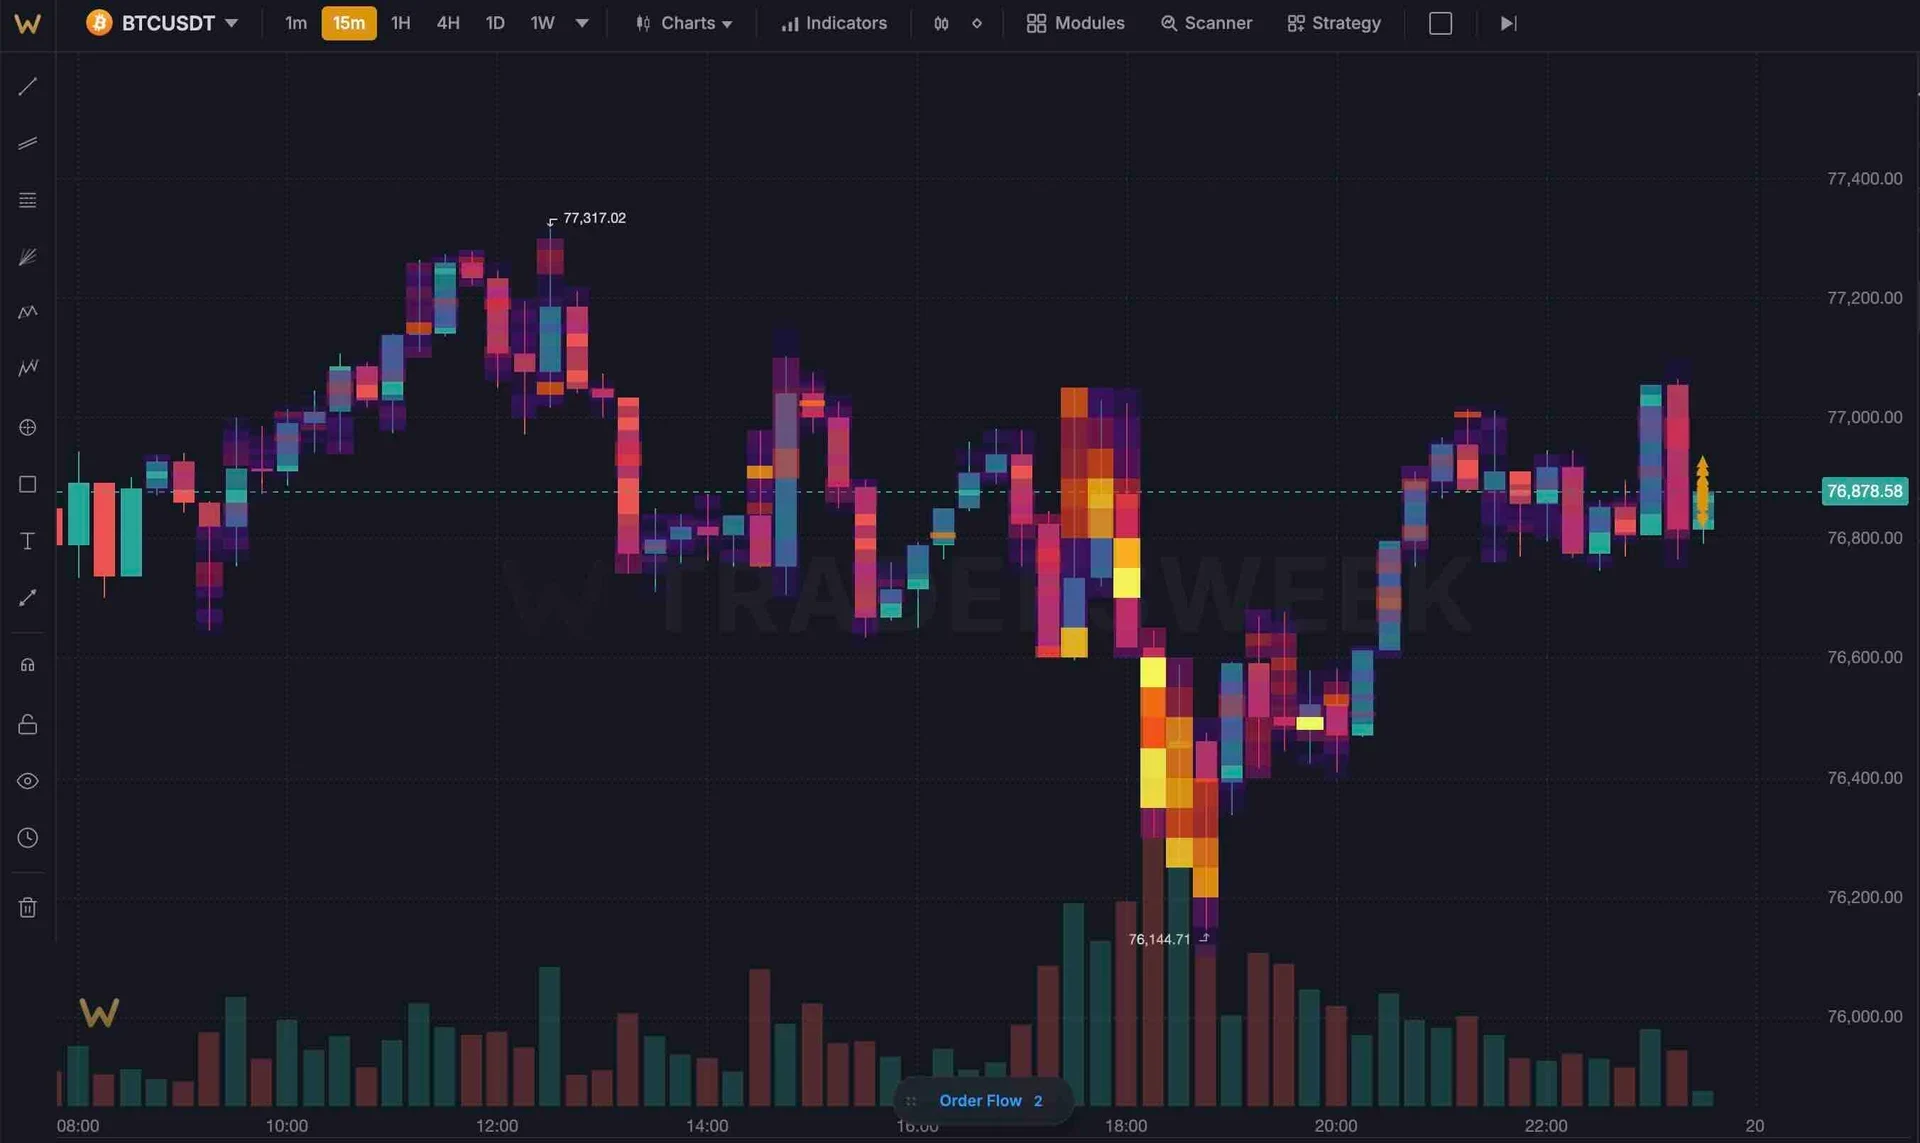
Detector de mapa de calor y grandes operaciones
El mapa de calor pinta la profundidad del libro de órdenes en tiempo real. El detector de grandes operaciones señala operaciones de tamaño institucional con tamaño, dirección y agresividad.
- Mapa de calor de profundidad en tiempo real
- Umbral de tamaño configurable
- Clasificación de agresividad vs pasividad
desde aggTrades del exchange — no instantáneas, no retrasado, no interpolado
Feeds WebSocket de Binance procesados tick a tick. Lo que ves es lo que el mercado está haciendo ahora mismo.
Integrado en el módulo
Delta por vela
Presión neta de compra vs venta visualizada en cada barra. Detecta divergencias entre precio y volumen.
Análisis de clústeres
Clústeres de volumen en niveles de precio clave. Identifica dónde los grandes participantes están acumulando o distribuyendo.
Integración con escáner
Las señales de flujo de órdenes alimentan directamente el escáner multi-timeframe. Busca desequilibrios entre instrumentos.
Multi-timeframe
Cambia de timeframe y el footprint se reconstruye al instante desde datos tick cacheados. Sin descargar de nuevo.
Umbrales personalizados
Define tus propios ratios de desequilibrio, tamaños de grandes operaciones y opacidad del mapa de calor. Cada trader lee la cinta de forma diferente.
Exportar capturas
Captura cualquier estado del footprint para llevar un diario o compartir. PNG con metadatos.
Del gráfico al footprint en tres clics
- 01
Activar el módulo
Abre el panel de Módulos en la barra lateral del terminal. Activa Order Flow. El módulo carga al instante.
- 02
Añadir footprint al gráfico
Haz clic derecho en cualquier gráfico, selecciona 'Añadir superposición' → Order Flow → Footprint. El perfil de volumen y el mapa de calor son superposiciones separadas.
- 03
Configurar umbrales
Abre la configuración del módulo para ajustar el ratio de desequilibrio, el tamaño de grandes operaciones y la paleta de colores del mapa de calor. Los valores predeterminados funcionan bien para cripto.
- 04
Leer la cinta
Observa clústeres de desequilibrio, divergencias delta e impresiones de grandes operaciones. Combínalo con el perfil de volumen para contexto.
¿Qué exchanges están soportados?
¿Es lo mismo que el footprint de TradingView?
¿Funciona en todos los timeframes?
¿Puedo usarlo en el plan gratuito?
Abre el terminal y activa el flujo de órdenes
Footprint en tiempo real, perfil de volumen, mapa de calor y grandes operaciones — esperando en el panel de Módulos.