2012issue C1276-77
A volatility persistence gate for index sleeves
A listed volatility index can license or withhold an equity-index sleeve only after a persistence window against a moving-average baseline. Documented timing-up and timing-down rules wait for 11 consecutive sessions versus 50-period averages of highs or lows. The same test was marked on a daily S&P 500 chart and mapped onto a DDM and SPY basket.
- Editorial reading: implied volatility is a construction gate. An index sleeve is switched only after a listed volatility index stays on one side of a moving-average baseline for a fixed persistence window.
- A timing-up rule fires after 11 consecutive sessions in which the volatility-index high stays above its 50-period moving average of highs. A timing-down rule fires after 11 consecutive sessions in which the volatility-index low stays below its 50-period moving average of lows.
- Independent encodings apply the same 11-session test versus a 50-day simple moving average as buy and sell marks on a daily S&P 500 chart, and as a basket mapped onto DDM and SPY.
- Reconstructions treat the published example as long-only, delay fills by one session after the end-of-day signal, and show that a reconstructed SPY path can diverge from listed trades dated before 3/8/2010.
Implied volatility as a sleeve gate
A listed volatility index is the market-regime input that licenses or withholds an equity-index sleeve. A moving average of the volatility-index high or low marks the high-versus-low regime baseline.
Editorial reading: this is a construction gate. The sleeve is switched only after the volatility index has stayed on one side of that baseline for a fixed run of sessions. The persistence window, not a one-bar forecast, decides when exposure is allowed.
The two persistence rules
Rule-based entry is the fully specified persistence test. It converts a consecutive-session count versus the baseline into a buy, sell, or stay-out action on the index sleeve.
One documented timing-up rule fires after 11 consecutive sessions in which the volatility-index high stays above its 50-period moving average of highs. The complementary timing-down rule fires after 11 consecutive sessions in which the volatility-index low stays below its 50-period moving average of lows.
Chart marks and a two-name basket
Independent encodings apply the same 11-session test of a volatility index versus its 50-day simple moving average to place sell and buy marks on a daily S&P 500 chart.
The same construction was packaged as a basket that maps those volatility-index signals onto DDM and SPY.
VIX daily low versus its 50-session average
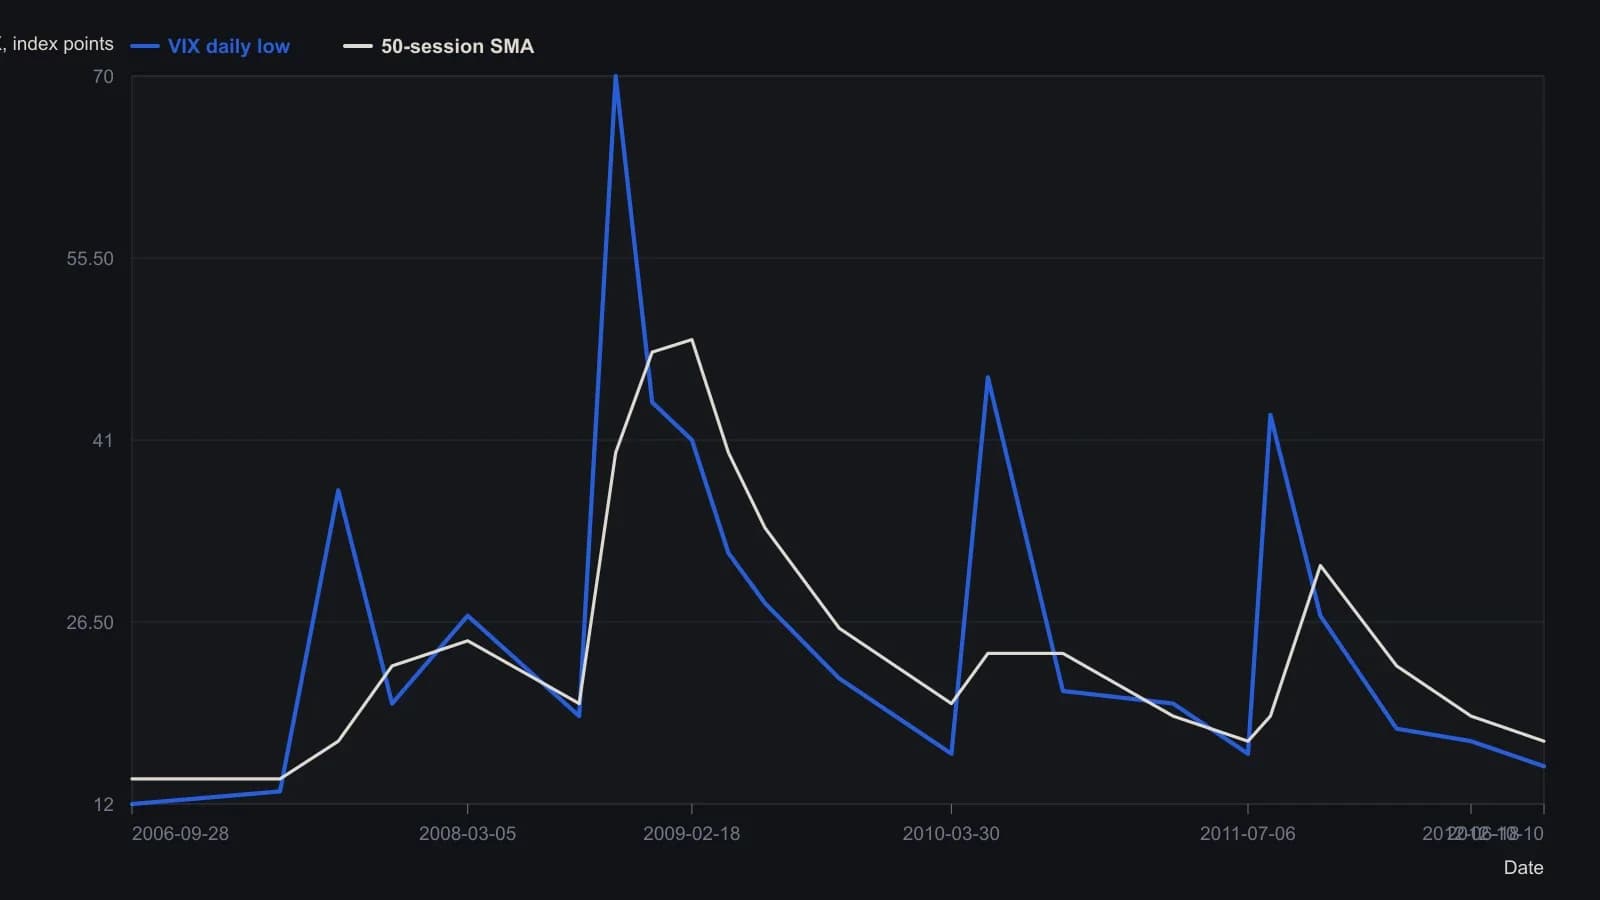
Signals wait for 11 consecutive sessions on one side of a 50-period average of highs or lows. The Excel reconstruction delayed fills one session after the end-of-day signal and charged no commissions. The plotted VIX series is the daily low, not the close.
How reconstructions fill the sleeve
Reconstructions treat the published example as long-only and note that a short overlay is mechanically available. They use an execution lag: a one-session delay between the end-of-day regime signal and the fill.
One reconstructed backtest omits commissions that the original platform run allowed. Each position is sized as a user-set fraction of cash available after prior closed trades.
Vendor series need not match
A reconstructed SPY path matched recent listed trades but diverged by as much as +0.50 on trades dated before 3/8/2010. Reconstructions therefore treat vendor series as inputs that need not match.