1998issue C061-3
Moving-average cross, range mode, and stop-reversals
A short-term moving average that price does not cross is treated as a trend boundary. An average-cross alerts that a range may be forming. After a recross, channel-bounds are labeled, range-trading fades those edges, and a stop-reversal outside the range is the only authorized handoff back to trend.
- Treat an uncrossed short-term moving average as a trend boundary, and read the first average-cross as a range-formation alert rather than proof of a new trend.
- After that cross, label channel-bounds from the prior swing extreme and the later recross, then fade those edges and withhold new trend entries until breakout.
- Still take the first post-cross trend signal the trend system requires, even though that trade can lose if price is only oscillating around the average.
- Place a stop-reversal outside the range to exit the failed fade and join the breakout. That order is the only authorized return to trend.
A one-sided trend boundary
A moving-average is a smoothed series of ordered prices. A short-term moving average that price does not cross is treated as a one-sided trend boundary. An average-cross is the first move of price through that average after a one-sided run. That cross is the first cue that a trading range may be forming rather than that a new trend has begun.
Labeling the channel-bounds
After the first average-cross, the prior swing extreme and the later recross of the average are labeled as the suspected range boundaries. Used together, those marks are the channel-bounds, the working support and resistance of the suspected range.
The first post-cross trend signal is still taken as required by the trend system, even though that trade can lose if prices are only oscillating around the average.
Light crude daily: average-cross then the $16–$18 range
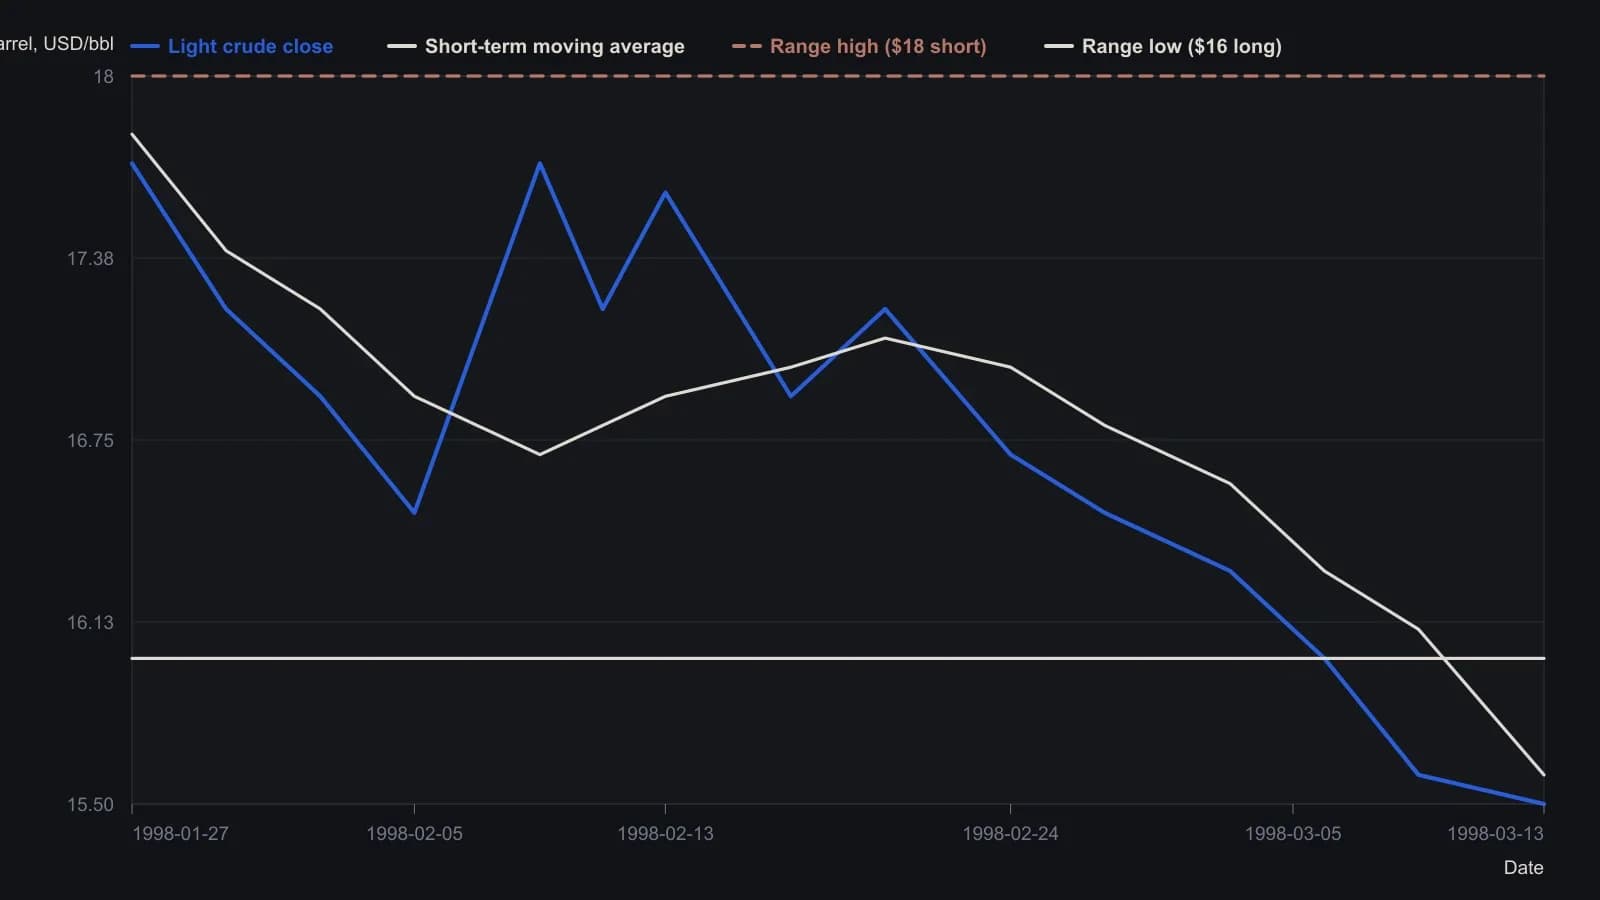
Dates follow the Monday axis labels on the daily TradeStation chart (2 Feb–16 Mar 1998); the first bars are the last sessions of January. The article never states the moving-average length (the platform header only reads “Mov Avg 2 lines”). Closes and the short average were read from the figure to the nearest $0.10. The $16 and $18 bounds are exact prices from the text.
Range-trading inside the labeled channel
Once the range is labeled, range-trading changes tactics to fading the channel edges and, optionally, taking same-session trades directed into the range. After a range is defined, new trend entries are withheld until breakout.
Range activity is expected to end with a losing breakout trade. Earlier channel trades are meant to offset that loss, and the same breakout is used to start a new trend position.
Price may cluster near the side of the eventual breakout, creating repeated short-horizon trades inside the channel and a late stop hit that can reverse into the new trend.
The stop-reversal handoff
A stop-loss is a pre-set exit that bounds a failed range trade. Stop-reversals placed outside the defined range both exit the losing fade and flip direction to join the breakout. That outside stop-reversal is the only authorized handoff back into trend.
Intraday moves outside the channel can trigger protective stops even if the session later finishes back inside the range. The same labeling and fade sequence can produce mixed same-session results, stop-reversal losses, and reentries while price is still inside the channel.
All readings on this track · 11 readings
- 1991Constructing Wyckoff readiness tests at range edges
- 1992A flat moving average as a range regime switch
- 1992A range-reentry case study with a shared adverse-excursion stop
- 1993Congestion boxes, edge candles, and the opening hour
- 1998Moving-average cross, range mode, and stop-reversals
- 2003When range regimes favor swing procedures over trend holds
- 2007Dollar range in a data-dependent rate regime
- 2008Construct a range-trade hypothesis from a price channel
- 2010Mechanical range trading with a global account stop
- 2015A quiet gold ETF range as a three-layer classroom problem
- 2016Regime-matched rules instead of price forecasts