2003issue C051-5
C-wave as the final leg of an ABC correction
A C-wave names the third and typically final declining stage of an ABC correction. Until that third leg is specified, a drop can still be read as an A-wave pause, and the correction hypothesis stays incomplete.
- A declining C wave is the third and typically final stage of a correction and is treated as sharing many traits of third waves.
- A-wave declines are often interpreted as temporary pauses in a still-intact advance, while C-wave declines are characterized as broader and more persistent.
- Wave degree from minute through supercycle is defined by rank among neighboring swings, not by a fixed span of years.
- A C-wave identification is a checkable hypothesis about a persistently negative climate, not a guarantee of timing or of a subsequent advance.
What a C-wave is asked to name
Elliott wave analysis is a structured reading of impulsive and corrective price swings that turns a repeatable chart condition into a testable directional hypothesis. In this Elliott wave reading, a declining C wave is the third and typically final stage of a correction and is treated as sharing many traits of third waves.
An ABC correction is a three-part countertrend sequence in which an A-wave break, a B-wave rebound, and a C-wave decline together unwind a prior advance. The A-wave is the first break of a prior advance, often mistaken for a brief pause rather than the start of a larger correction. The B-wave is the intervening rebound inside a correction and is typically expected to be fully retraced by the following C wave.
Broader than the opening break
A-wave declines are often interpreted as temporary pauses in a still-intact advance, whereas C-wave declines are characterized as broader and more persistent. A corrective wave is a countertrend swing that retraces part of a prior impulse rather than extending the main trend. The C-wave is described as broader and more persistent than the opening A-wave break.
Degree is a rank, not a calendar span
Elliott wave degrees from minute through supercycle are defined relative to one another rather than as fixed spans of years. Primary degree is a relatively large Elliott wave scale defined by its rank among neighboring degrees rather than by a fixed calendar length.
Historical C-wave cases
One contemporaneous S&P 500 count framed the decline that began in early 2000 as a primary-degree A-B-C, with the A wave lasting about 18 months into October 2001, the B wave about six months into March 2002, and the C wave beginning in March 2002 and about 11 months old at the time of writing.
The 1930-1932 Dow decline is used as a C-wave case: an opening drop from 386 to 225, a rebound from 225 to 297, then a C-wave fall from 297 to 41, with most of the 1929-1932 peak-to-trough loss occurring in that final leg.
The late-1960s-to-1970s bear is presented as a more complex five-wave triangle rather than a simple three-wave correction, with the 1969-1970 drop counted as the C wave and taking the Dow from 1000 to 625.
A 2002-2003 S&P 500 count treated the move after the late-spring-2002 peak as a primary C wave containing an internal five-wave decline that appeared nearly complete except for a fifth downswing.
A checkable climate, not a timing promise
A social-mood extension of the count associates the most intense large-scale conflicts with large C waves of primary degree and higher, treats A waves of any size as rarely coinciding with war, and notes the 2001 primary A wave that immediately preceded a brief conflict as an exception.
The teaching use of a C-wave identification is to form a checkable hypothesis about a persistently negative climate, not a guarantee of timing or of a subsequent advance.
Dow industrials through the 1930–1932 C-wave
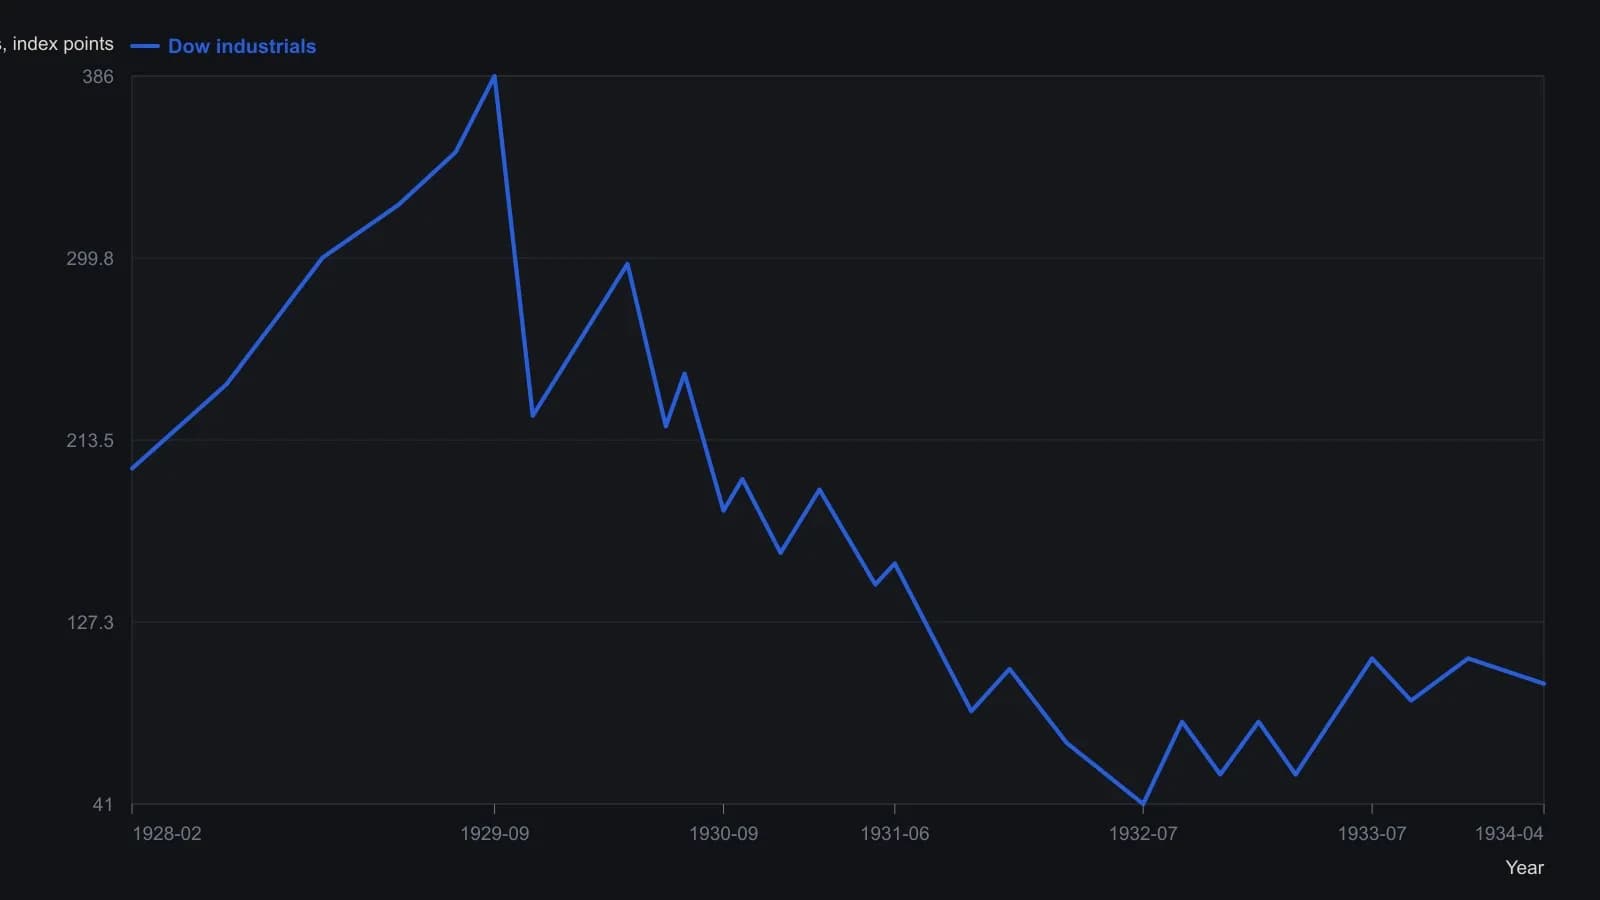
The source plot is logarithmic. Intermediate swing readings are approximate from the raster and are given as whole index points. 386, 225, 297 and 41 are the article’s stated levels, not measured off the page.
All readings on this track · 6 readings
- 1990A five-wave C finish as an Elliott count contract
- 1994Constructing impulse and corrective Elliott wave labels
- 2002When fifth-impulse rules end a bull too soon
- 2003C-wave as the final leg of an ABC correction
- 2011Treat labeled Impulse wave and Corrective wave counts as a live hypothesis
- 2015Constructing five-three impulse and corrective wave counts