Product Updates11 new indicators added to the platform
Product Updates
11 new indicators added to the platform
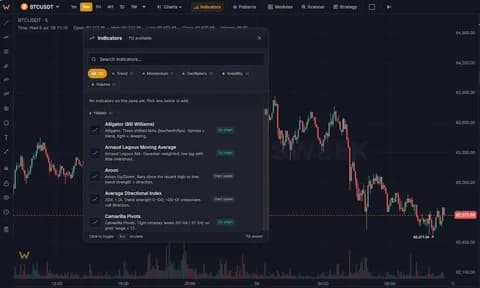
Eleven new studies join the Indicators menu — from WaveTrend and QQE MOD to a machine-learning Lorentzian Classification model.
Eleven new studies
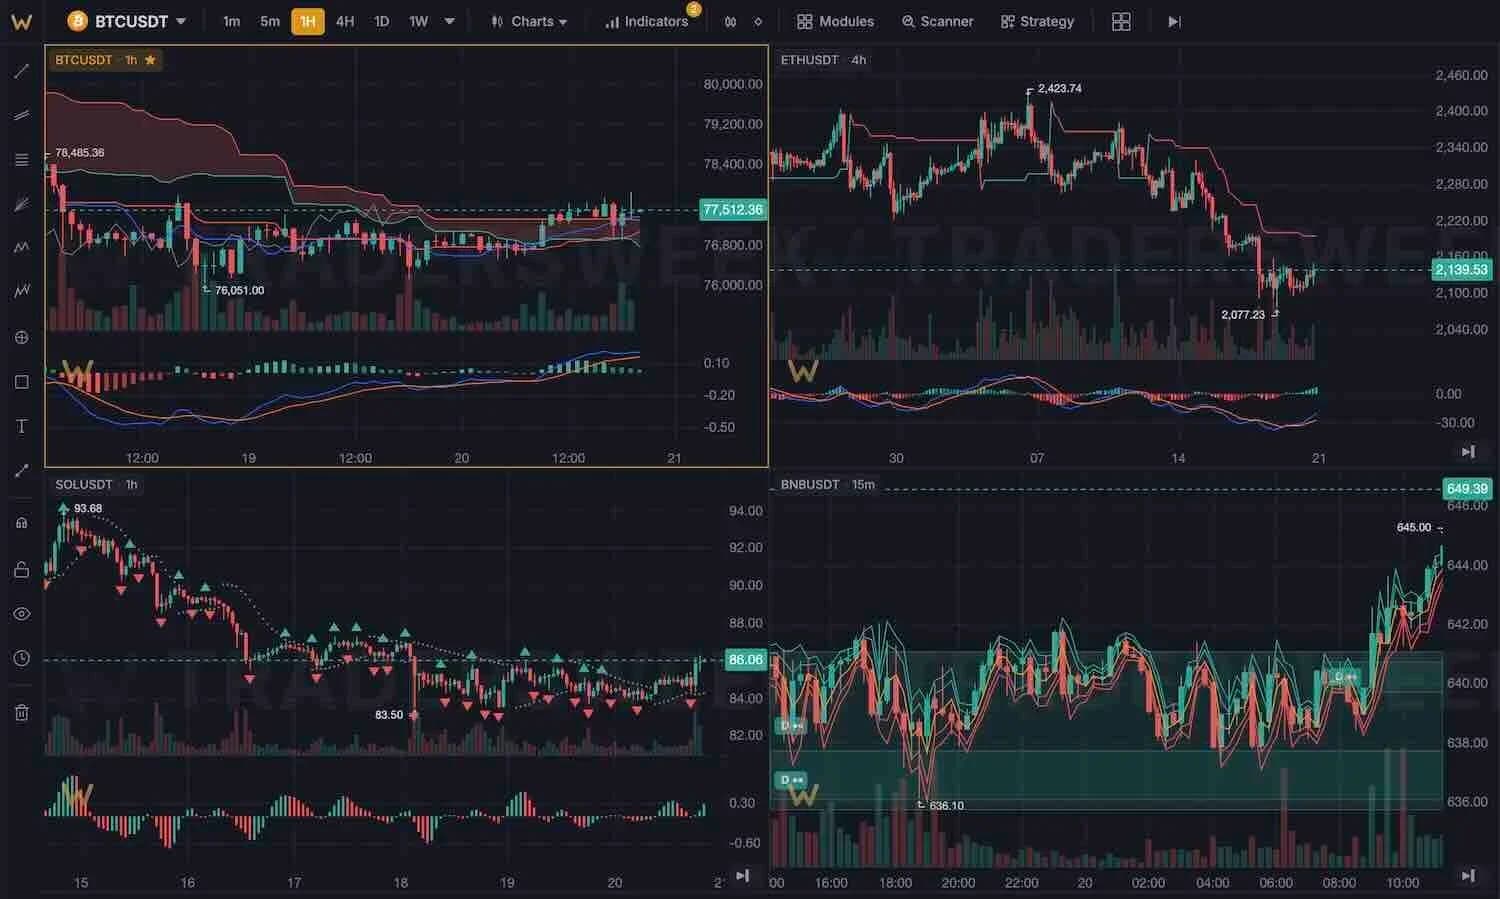
The Indicators menu just gained eleven new studies — spanning momentum oscillators, trend filters, relative strength and a machine-learning classifier. All of them also feed the new Indicator Barometer.
- WaveTrend — a smoothed momentum oscillator that flags overbought and oversold turns through its line crossovers.
- QQE MOD — a smoothed, RSI-based momentum indicator with a signal line and bands for reading trend strength.
- Nadaraya-Watson — a kernel-regression smoother that draws a clean estimate of the underlying trend and dynamic support and resistance.
- TD Sequential — DeMark's setup-and-countdown counter that highlights potential exhaustion and reversal points.
- Mansfield RS — Stan Weinstein's relative-strength line that shows whether a symbol is out- or under-performing its benchmark.
- HalfTrend — a noise-filtered trend indicator with clear up and down lines and reversal markers.
- Range Filter — filters price by its recent range to define trend direction and cut down on whipsaws.
- DeMarker — a demand and supply oscillator that spots overbought, oversold and turning points.
- Value Chart — a volatility-normalised view of price that shows how cheap or expensive the market is versus recent volatility.
- Lorentzian Classification — a machine-learning k-nearest-neighbours model that estimates the likely next move from a set of features.
- Lorentzian Signals — on-chart entry and exit signals built on the Lorentzian model, with volatility, regime and kernel filters.