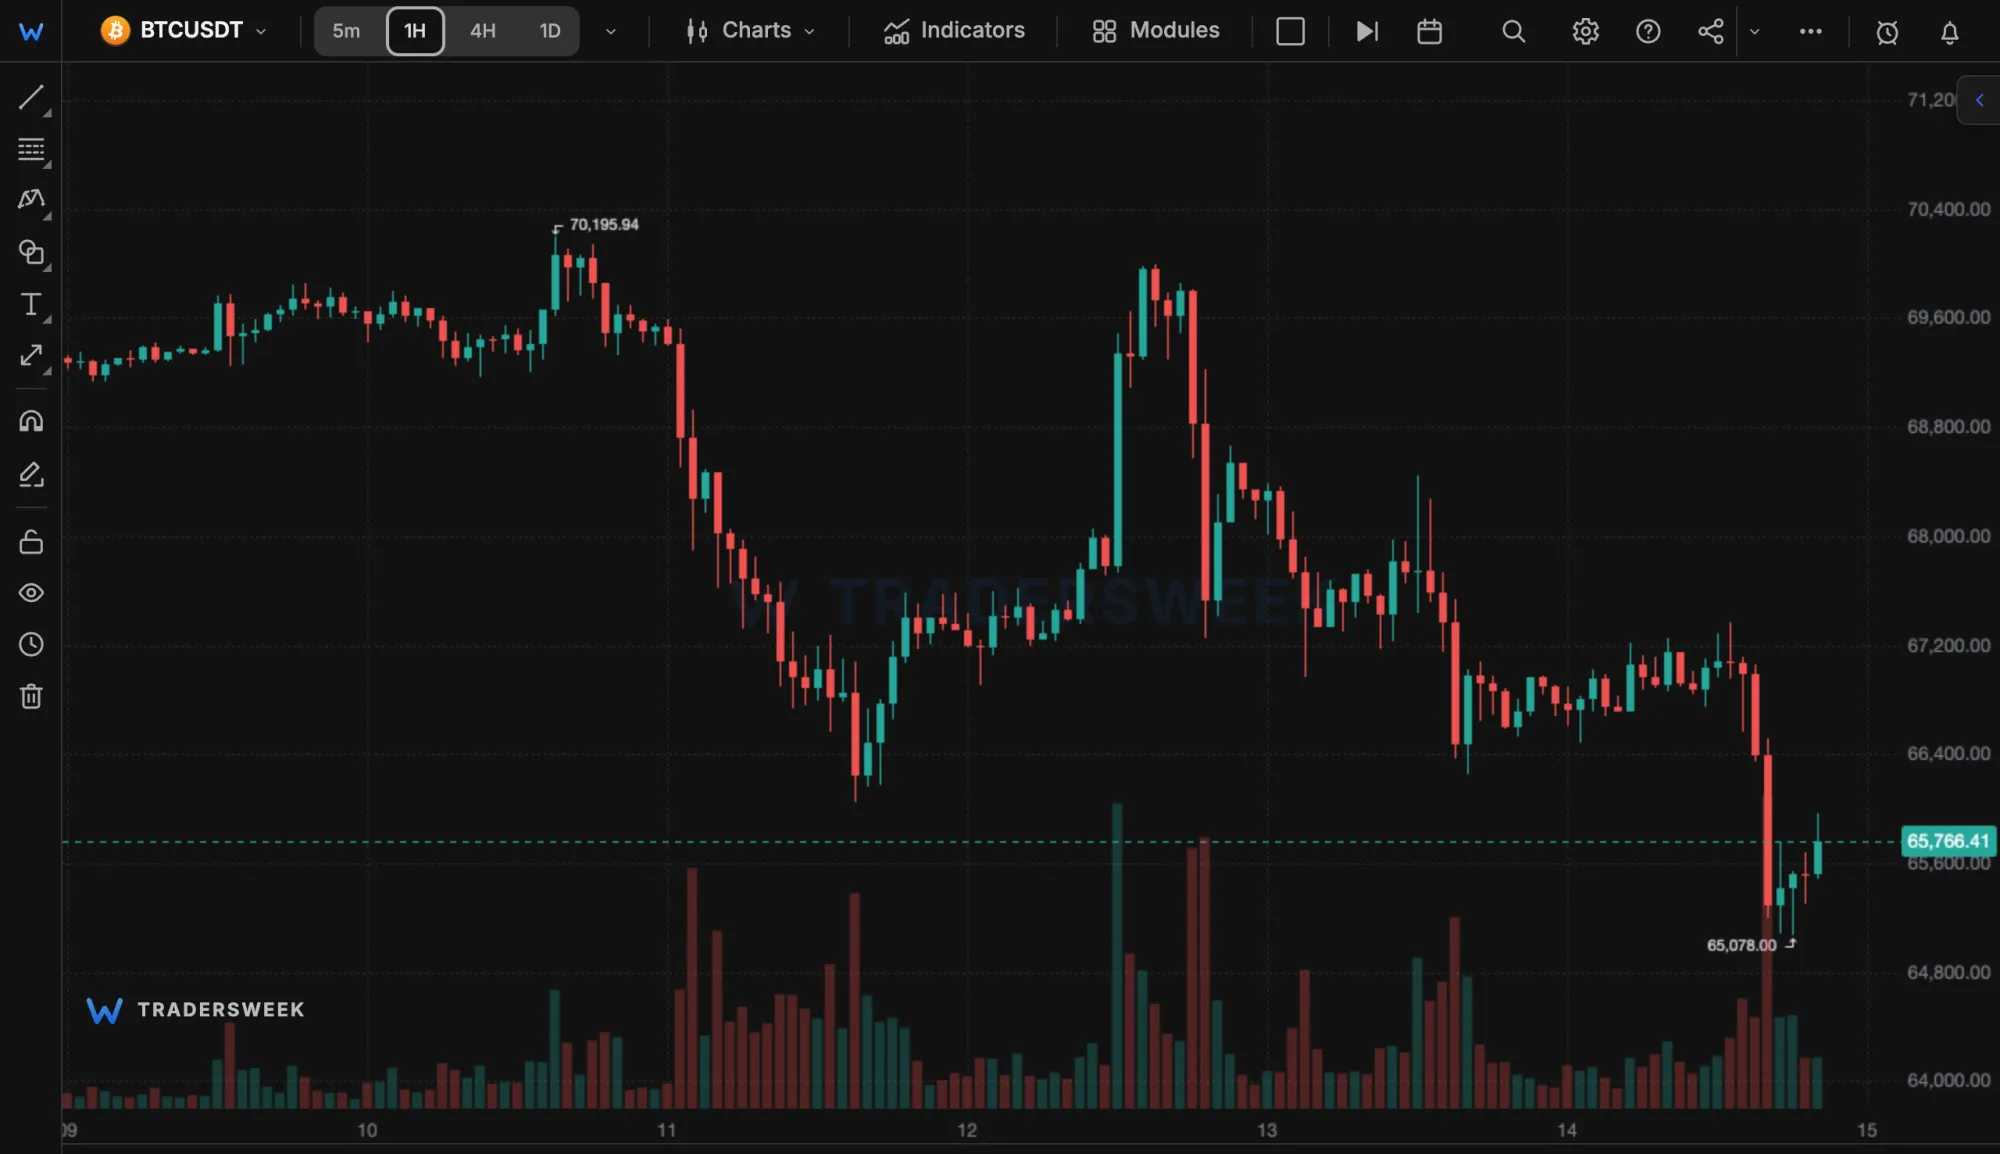
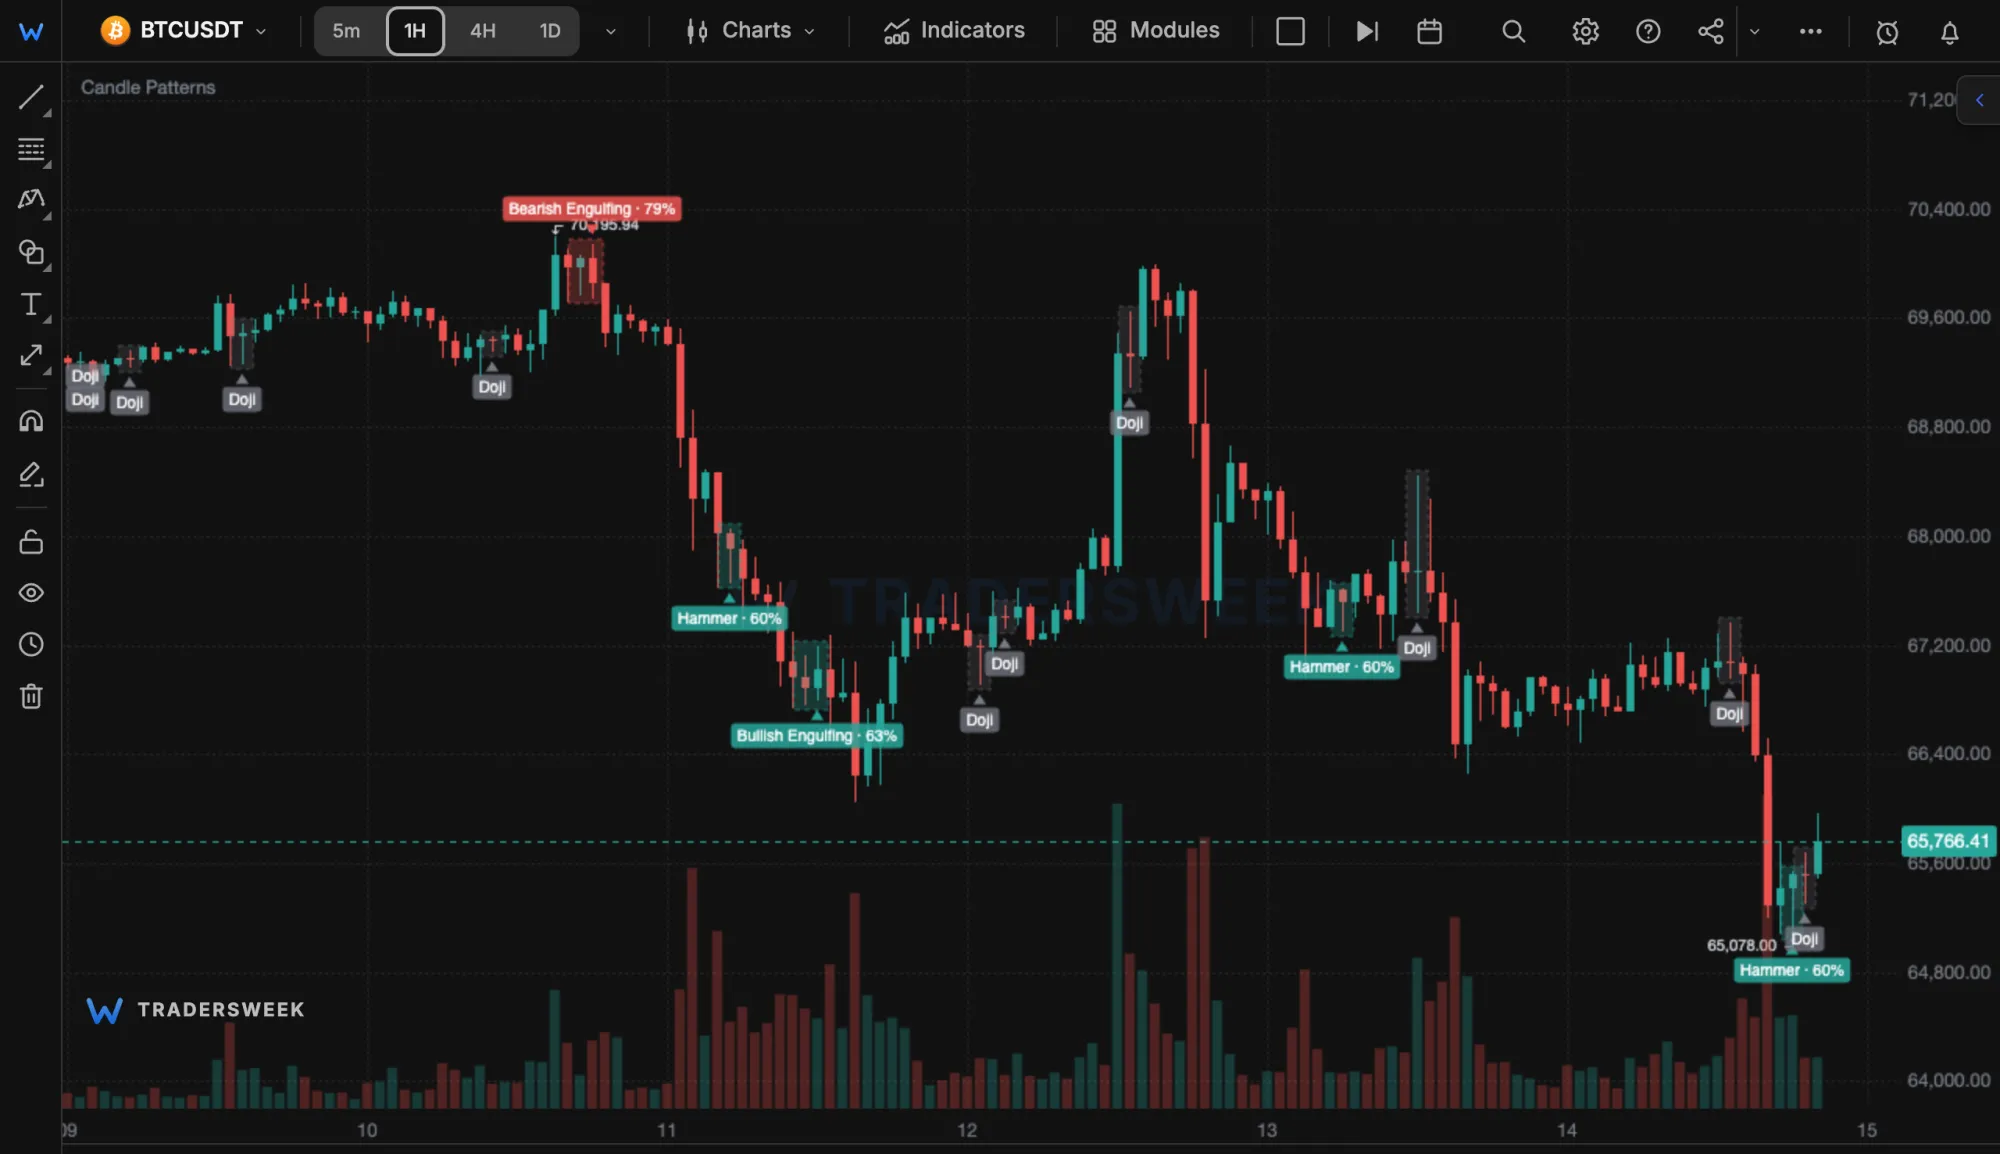
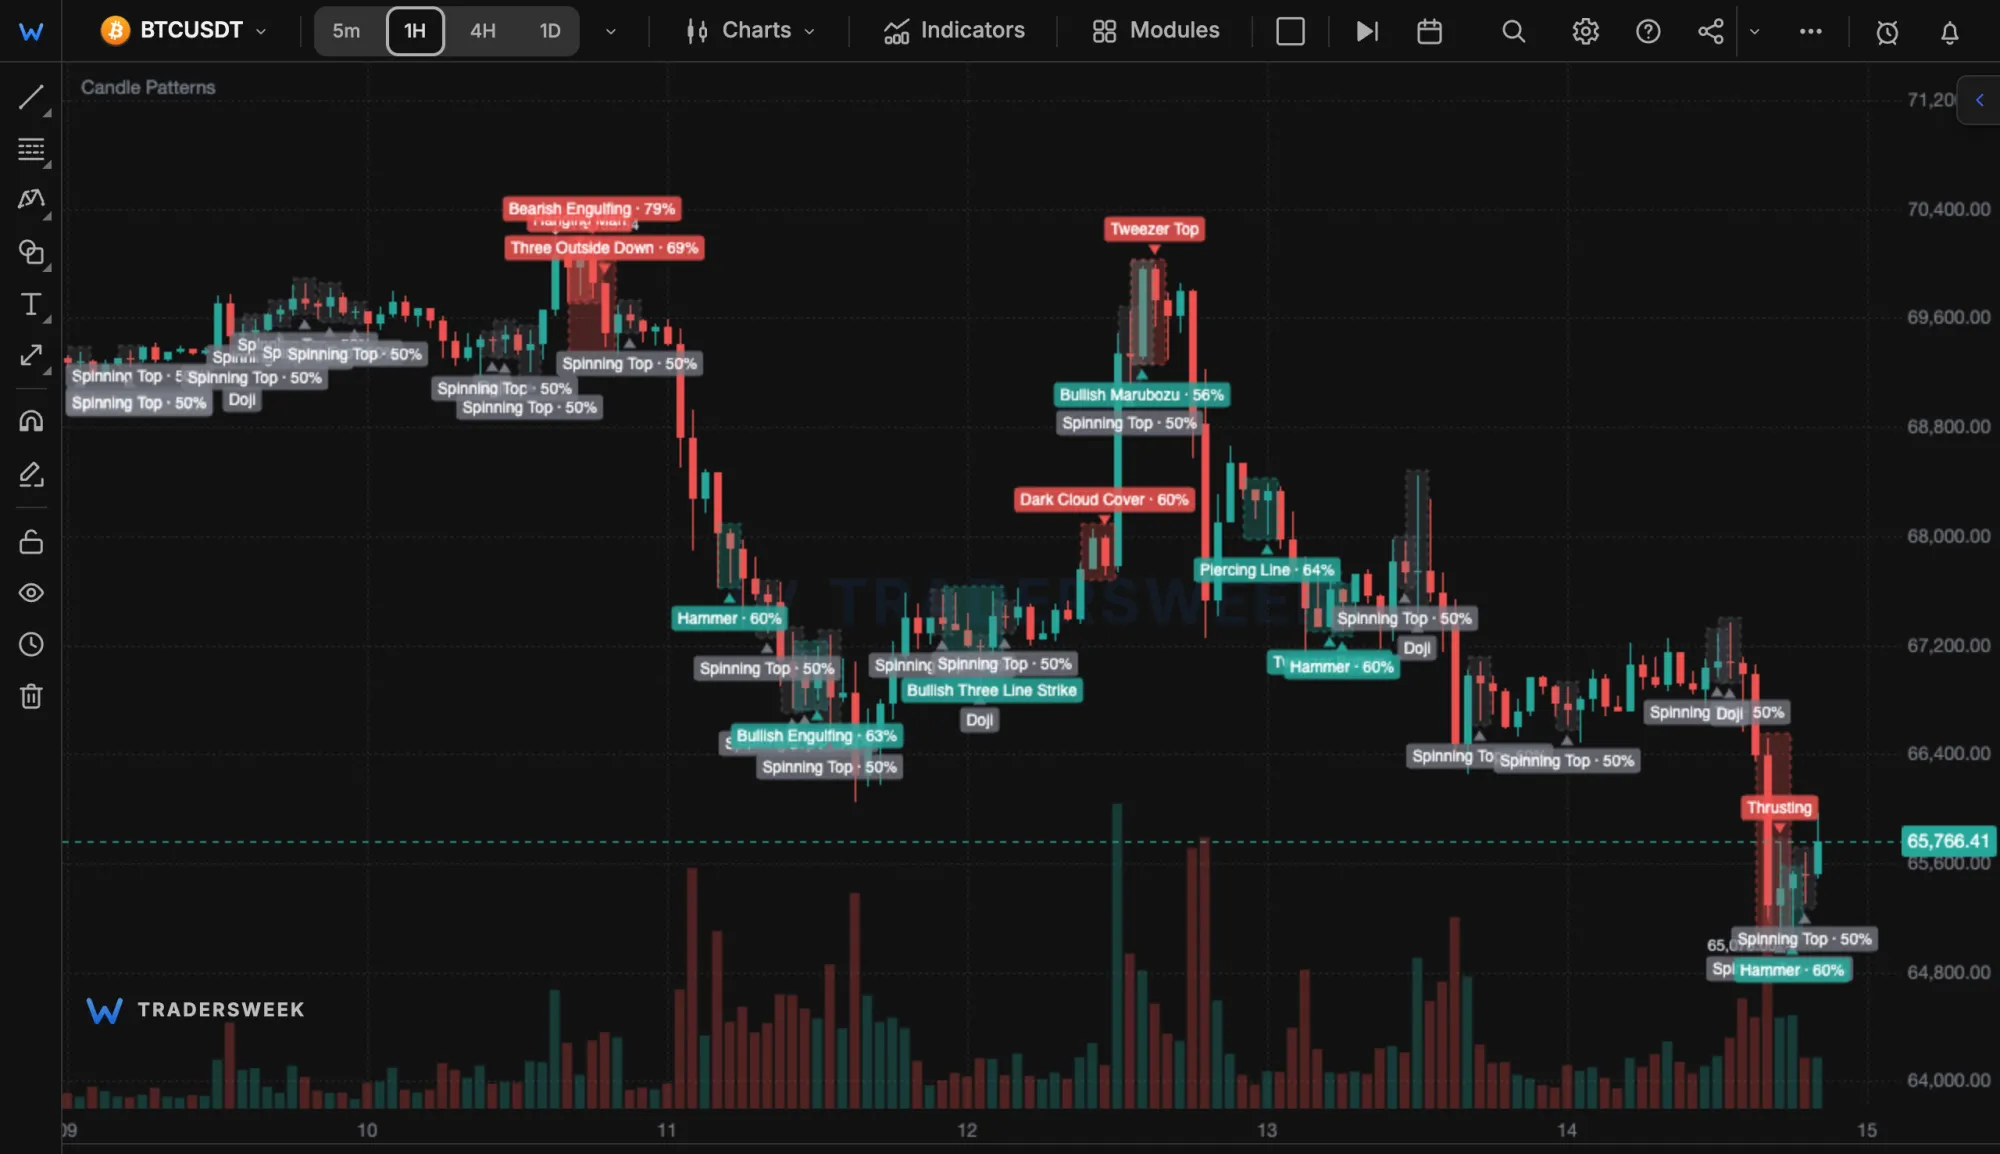
 BTCUSDT 1H, June 2024: patterns off
Candlestick pattern recognitionName it.
Then doubt it.
TradersWeek marks 85 candlestick patterns on bars that have closed, so a label never repaints. Where Thomas Bulkowski tested a pattern, the label carries his rate, and the panel shows how the same pattern did on your chart. Free with a sign-in.
Nothing on the open.
A name on the close.
Detection reads only bars that have closed. The bar still forming is left out, so a label appears once its last candle is done and stays where it landed. There are no sliders to tune: each of the 85 patterns is a fixed rule about bodies, wicks and the move that came before.
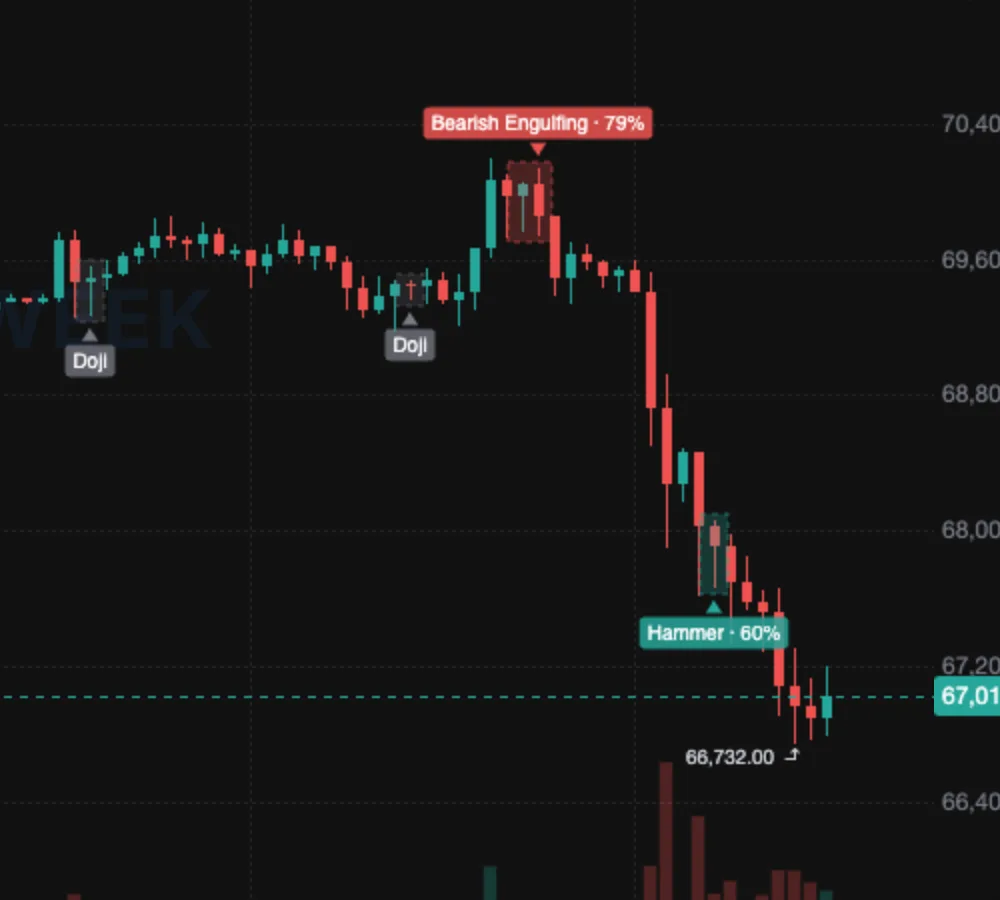
Bar open. A green candle is forming. No label.
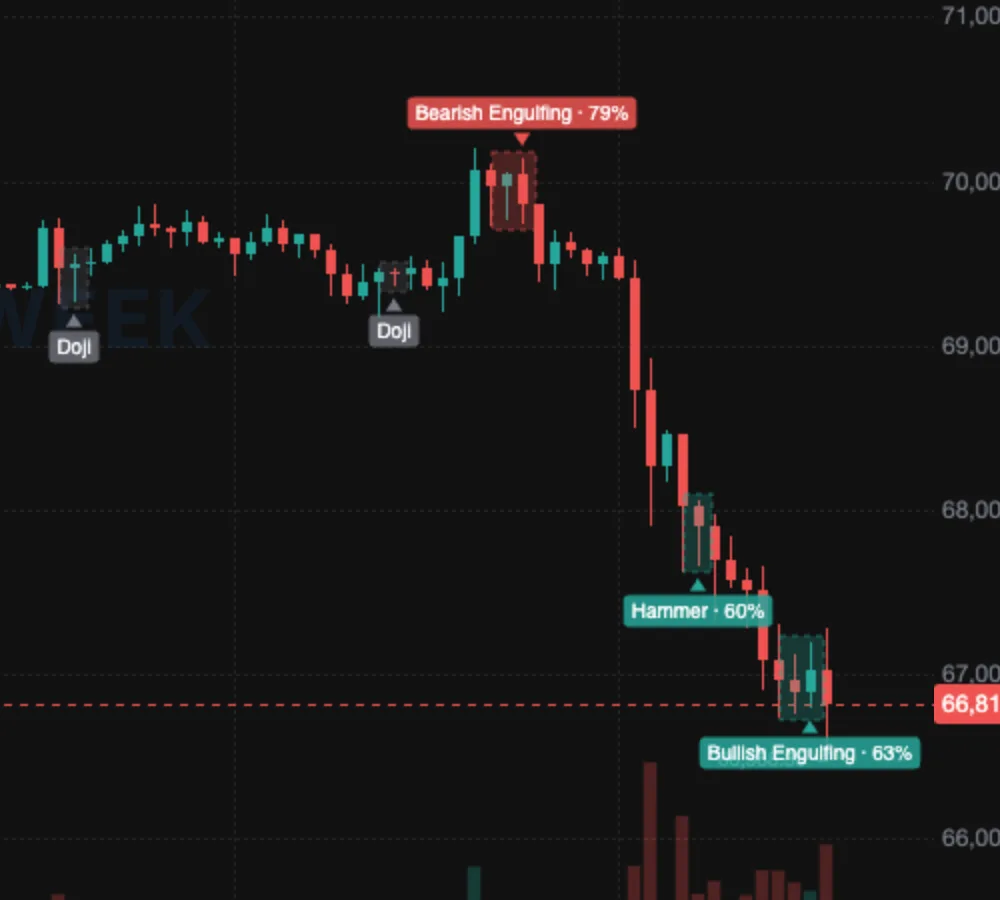
One step later. It closed, and the pair reads Bullish Engulfing, 63%.
One candle
17 patterns. Hammer, Shooting Star, Marubozu, the doji family.
Two candles
27 patterns. Engulfing, Piercing Line, Dark Cloud Cover, Harami, Tweezers.
Three candles
30 patterns. Morning and Evening Star, Three White Soldiers, Three Black Crows.
Four candles
5 patterns. Three Line Strike, bullish and bearish.
Five candles
6 patterns. Rising and Falling Three Methods, Mat Hold.
Book: 79%.
Chart: 2 of 10.
Each row in the Patterns panel can carry two numbers. Historical is Thomas Bulkowski's rate from the Encyclopedia of Candlestick Charts. On this symbol weighs the same pattern against a random entry in the same direction on the history loaded on your chart: a win is a move of at least 0.5% its way 5 bars later, and the badge shows the gap in percentage points. Under 10 separate cases it shows only the count. Both settings are yours.
37 of 85 patterns carry a Bulkowski rate. The other 48 show none: neutral candles such as the spinning top, patterns he tested against their name, and ones he never tested. We leave the space blank. His rates come from bull markets; a starred one rests on a single source.
| Pattern | Historical | On this symbol | Bullish |
|---|---|---|---|
| Bearish EngulfingBear body engulfs the prior bull body after an uptrend | 79% | 0 pp · 10 | ↓ |
| Bullish EngulfingBull body engulfs the prior bear body after a downtrend | 63% | n=8 | ↑ |
| Dark Cloud CoverBear opens above the prior close, closes below its midpoint | 60% | n=6 | ↓ |
| HammerLong lower wick (≥2× body) after a downtrend | 60%* | n=3 | ↑ |
| Hanging ManHammer shape after an uptrend | No historical rate | n=1 | ↓ |
Past one candle.
Figures and harmonics.
Wedges, flags, double bottoms, head and shoulders: 26 chart figures traced from swing points, and 16 harmonic shapes from Gartley to 5-0, in the same panel. Turn on levels and a figure or a harmonic draws its entry, target and stop; a harmonic also shades its reversal zone, and one still forming shows the zone where D is expected.
The percent on a figure is how closely it fits its shape, not how often it worked. Bulkowski's rates cover candles only.
- Chart figures
- 26: 12 bullish, 11 bearish, 3 neutral
- Harmonics
- 16, each in a bullish and a bearish form
- Levels
- Entry, target, stop on figures and harmonics. Reversal zone on harmonics
- Tuning
- Sensitivity from Strict to Many, Scale from Small to Large
- Reads
- Closed bars, the last 1,500 of them
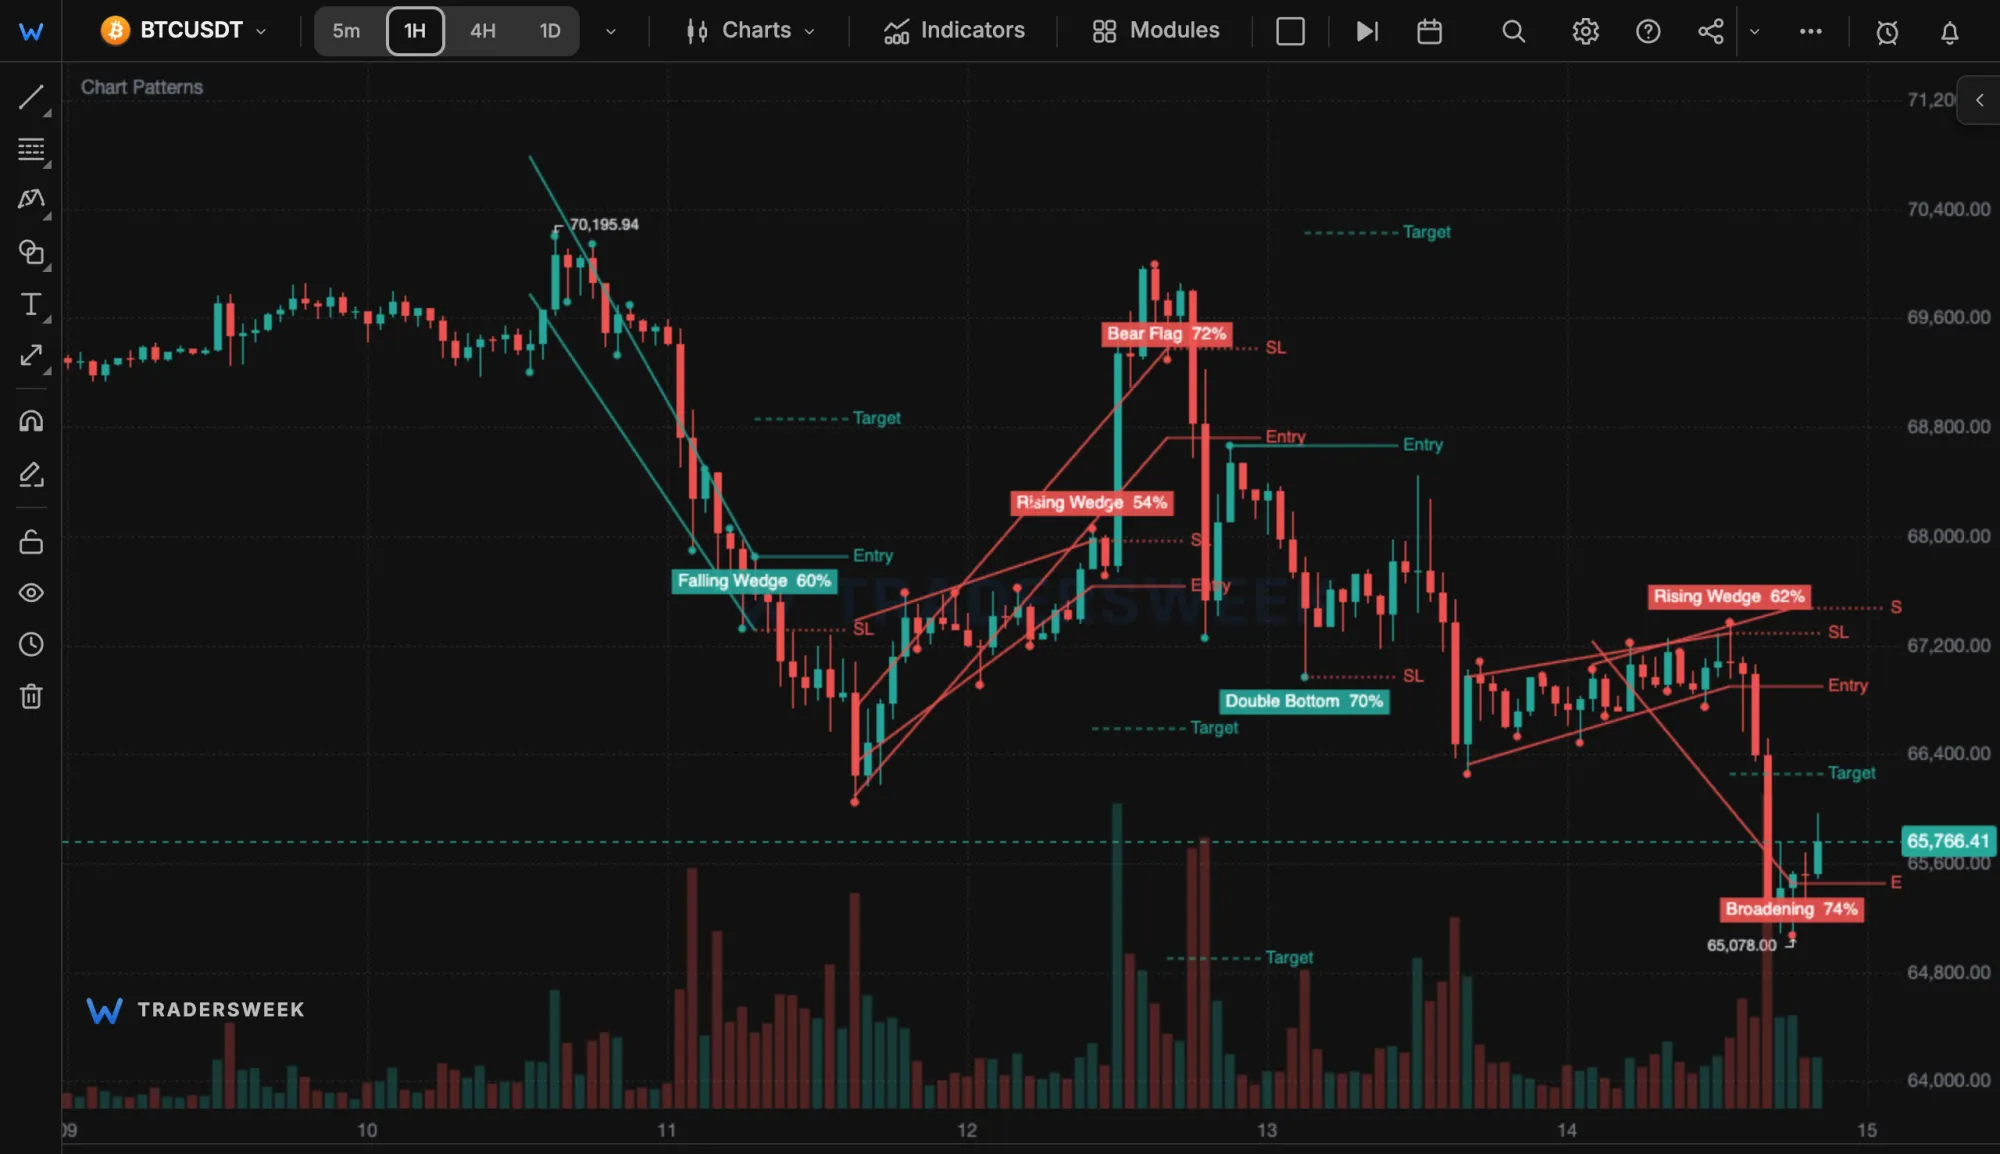
Same week, chart figures. Falling Wedge 60%, Bear Flag 72%, Double Bottom 70%, each with its levels.
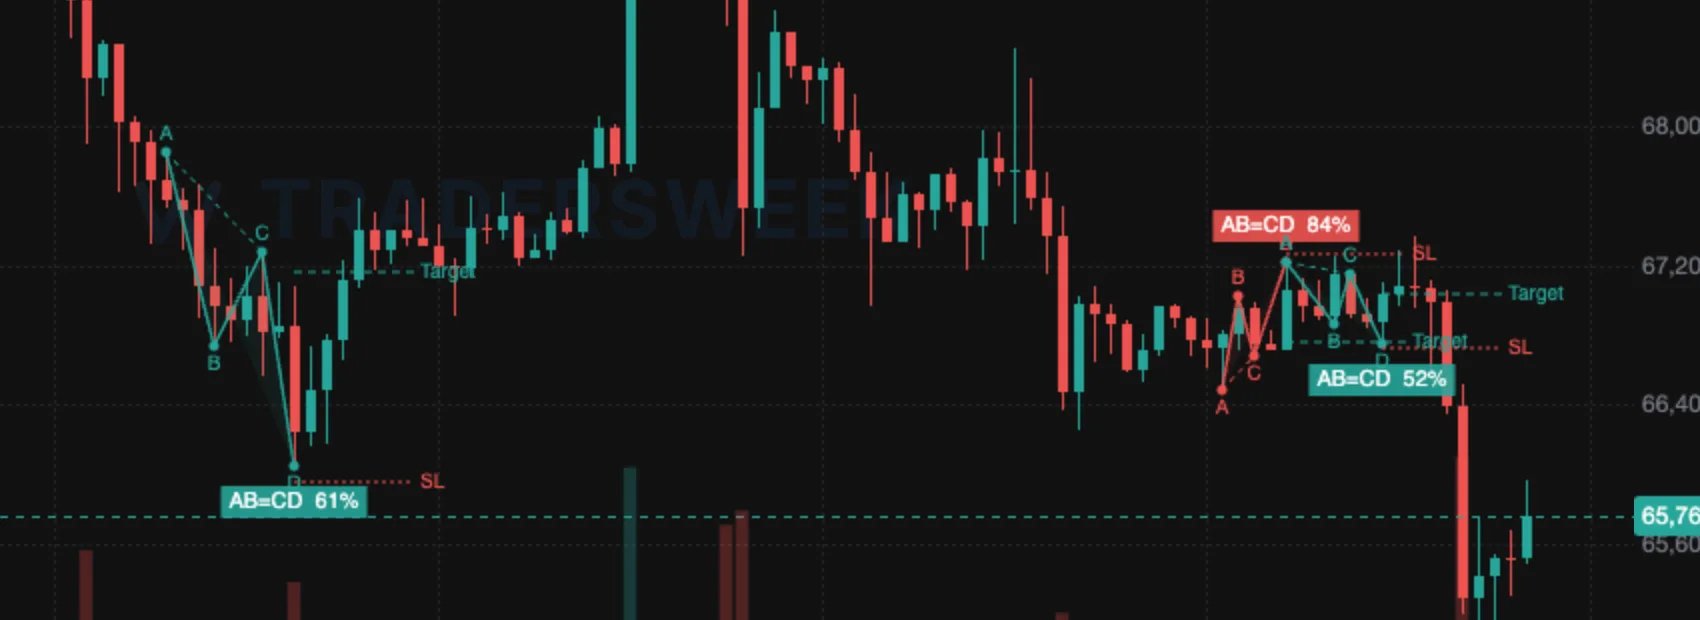
Harmonics. Three AB=CD legs this week, each with a target and a stop.
What lands
on the chart.
Labels draw on the active pane. Descriptions are in English, pattern names too except in the Russian interface, and your selection is kept in this browser, not in the account.
| Layer | The number on it | What it does not do |
|---|---|---|
| Candlestick85 patterns | Bulkowski's rate, where he tested it | No sensitivity sliders |
| Chart figures26 | Fit to the shape | No historical rate |
| Harmonics16 | Fit to the shape | No historical rate, not in the scanner |
Pattern questions
- Are patterns free?
- Yes. All 85 candle patterns, the chart figures and the harmonics are on the free plan. Patterns need a sign-in.
- Does a label repaint?
- A candle label doesn't: the forming bar is left out of detection, so it appears when its last bar closes and stays. A chart figure or harmonic still forming can re-fit as new swings confirm; once it breaks out or completes, it stays as drawn.
- Is a high percentage a signal to trade?
- No. It is how often the pattern did its job in Bulkowski's bull-market sample. The second number compares the pattern with a random entry on your symbol; under 10 cases you see only the count.
- Do patterns work on Heikin Ashi or Renko?
- They read the bars the chart draws. On Heikin Ashi, Renko, Kagi, Point & Figure and Range those bars are rebuilt, so a label there describes the rebuilt bar, not the exchange candle.
- Can I scan the market for a pattern?
- The 81 directional candle patterns are also rules in the scanner, on Pro at $30 a month. A scanner signal needs at least 2 rules to agree, so a pattern on its own does not raise one.